Unit 3: Building a Conceptual Data Model
Unit 3: Building a Conceptual Data Model

In this unit, you’ll apply the concepts learned so far to evaluate a statistical table and produce a Conceptual Data Model by identifying the core statistical concepts of:
- Statistical Unit
- Population
- Statistical Measure
- Variables
- Reference Times
Making a start: Data in tables
Data in tables are the starting point for most structural modelling (and SDMX) projects. So, it’s with data in a table that we’ll practice structural modelling.
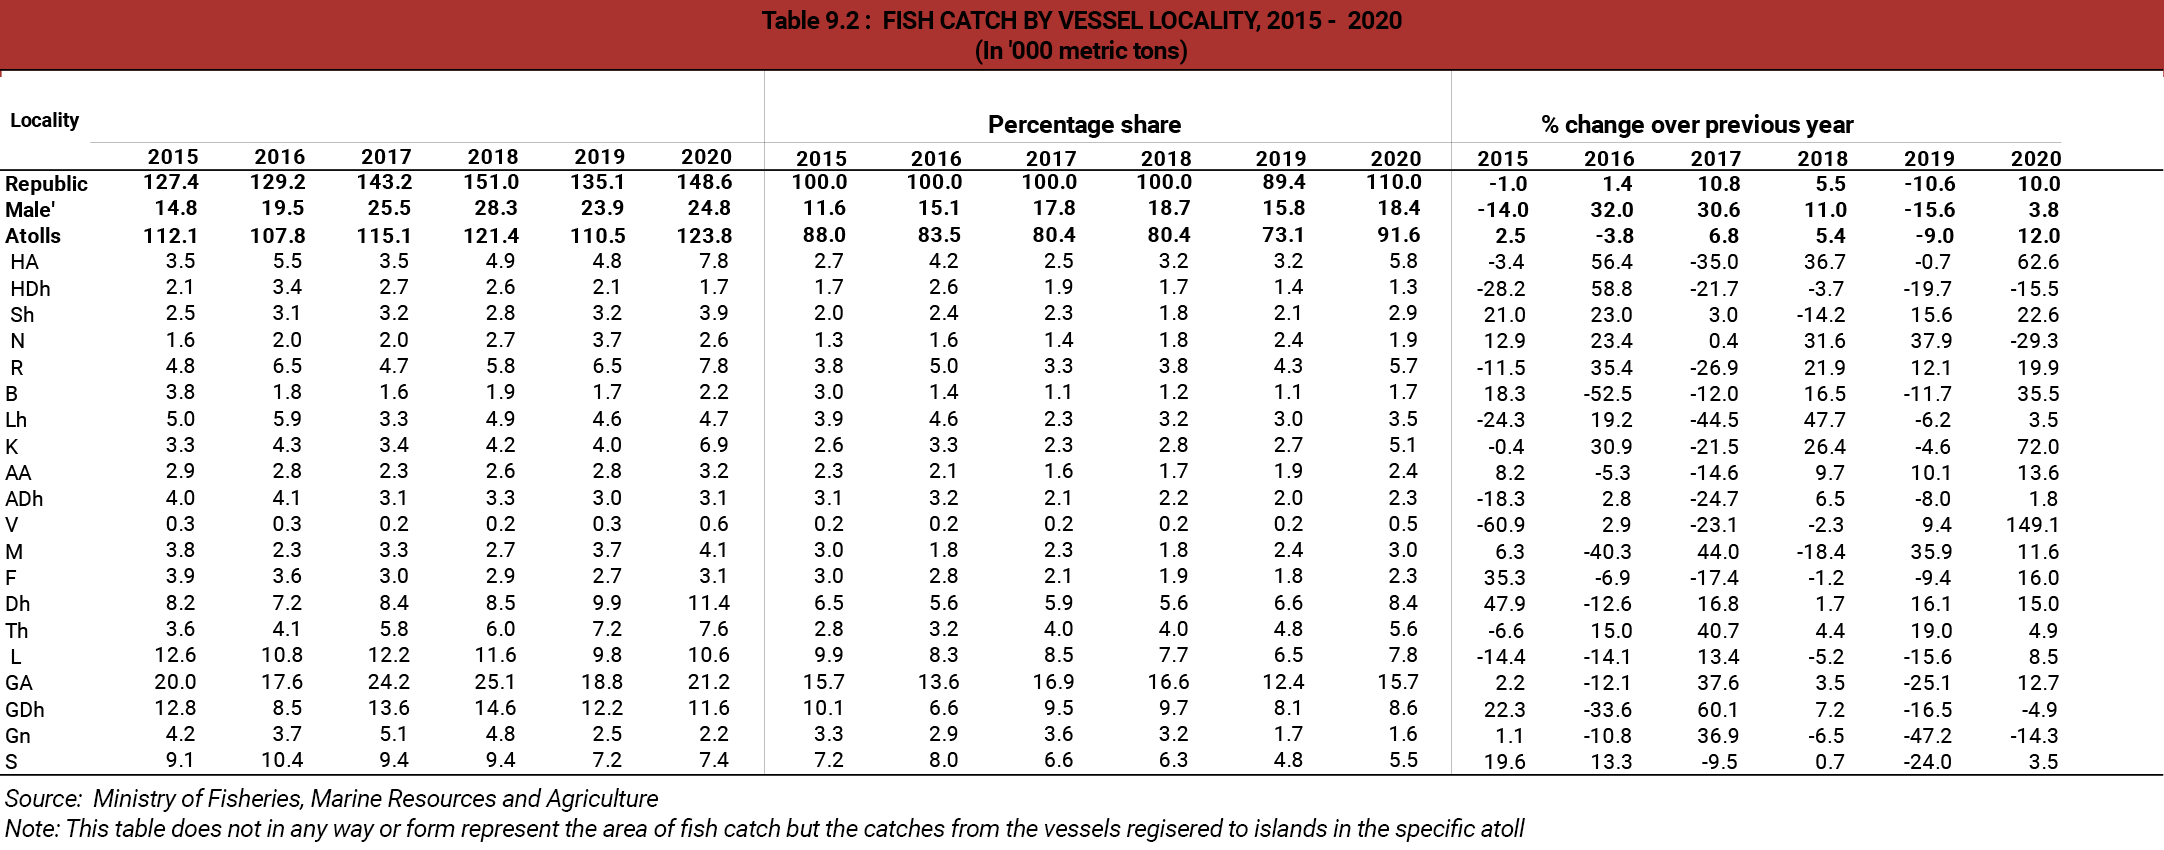
We’ll use this table from the Statistical Yearbook of the Republic of Maldives, Table 9.2 Fish Catch by Vessel Locality, 2015-2020.
Select the table to enlarge. ![]()
Apply statistical concepts
In applying our statistical concepts to the above table, we start to define our structural model by identifying the statistics and statistical concepts. There are also some key considerations we need to take into account.
Select each question to see the answer.
Structural modelling of the data
By applying the concepts we covered earlier to evaluate our data table, we can produce a Conceptual Data Model for the three referenced statistics by identifying the core statistical concepts of statistical unit, population, statistical measure, variables, and reference times.
Select the table to enlarge. ![]()
Then select the tabs to see the statistical concepts for each statistic.

Statistical concepts for statistic:
FISH CATCH BY VESSEL LOCALITY, 2015 - 2020
Statistical unit:
- the statistical unit (counted object) is ‘fish catch’ (abstract)
Population:
- fish catch, in Republic of Maldives, from registered vessel, in year X
Statistical Measure:
- ‘Total (of objects in the population)’ which is ‘total fish catch’
Variables:
- Population-defining properties:
- where caught: Republic of Maldives
- method of catch: registered vessel
Classification variables:
- vessel locality (locality of vessel registration) (Malé or atoll)
Reference times:
- year 2015 - 2020
Statistical concepts for statistic:
Percentage of FISH CATCH BY VESSEL LOCALITY, 2015 - 2020
Statistical unit:
- the statistical unit (counted object) is ‘fish catch’ (abstract)
Population:
- fish catch, in Republic of Maldives, from registered vessel, in year X
Statistical Measure:
- ‘Percentage of total (of objects in the population)’ which is ‘percentage of total fish catch’
Variables:
- Population-defining properties:
- where caught: Republic of Maldives
- method of catch: registered vessel
Classification variables:
- vessel locality (locality of vessel registration) (Malé or atoll)
Reference times:
- year 2015 - 2020
Statistical concepts for statistic:
%Change over previous year of FISH CATCH BY VESSEL LOCALITY, 2015 - 2020
Statistical unit:
- the statistical unit (counted object) is ‘fish catch’ (abstract)
Population:
- fish catch, in Republic of Maldives, from registered vessel, in year X
Statistical Measure:
- ‘Percentage change over previous year of (of objects in the population)’ which is ‘percentage change over previous year of fish catch’
Variables:
- Population-defining properties:
- where caught: Republic of Maldives
- method of catch: registered vessel
Classification variables:
- vessel locality (locality of vessel registration) (Malé or atoll)
Reference times:
- year 2015 - 2020
Conceptual Data Model Table
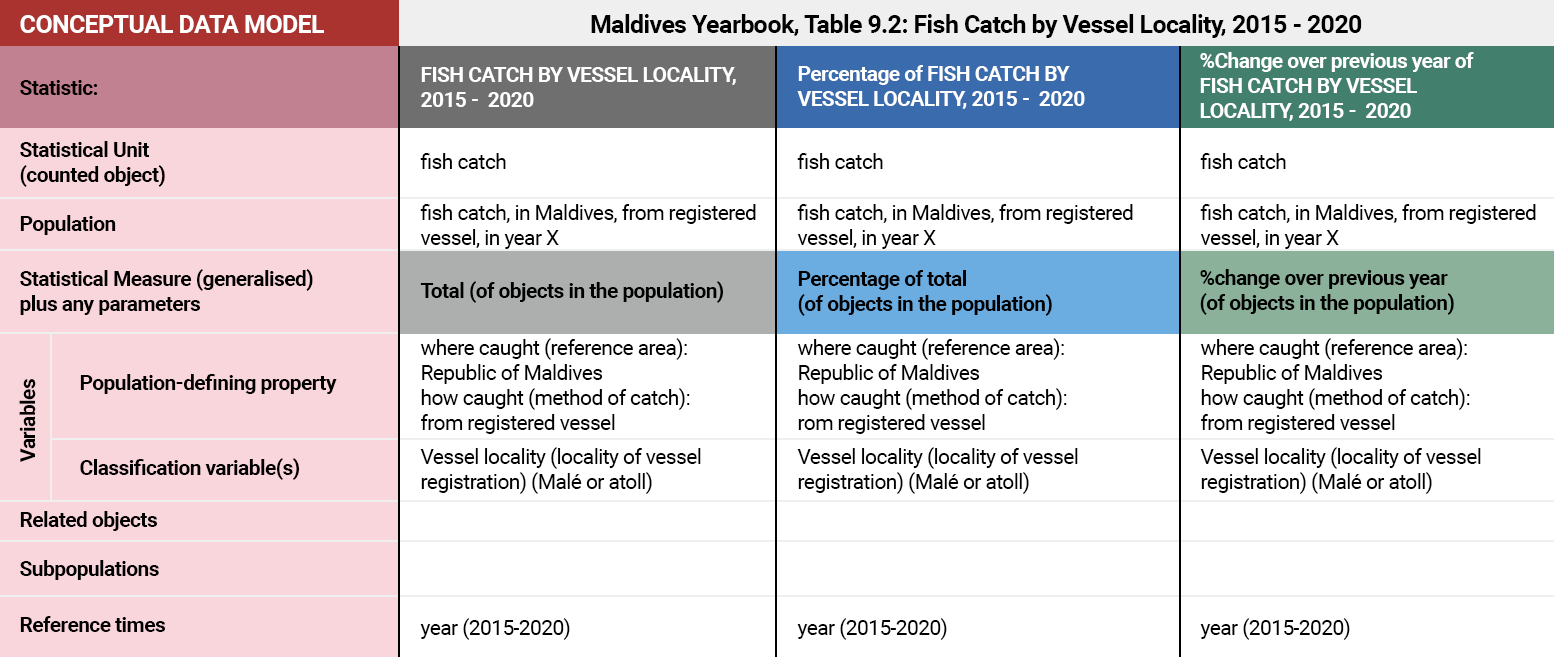
In tabular format, the Conceptual Data Model is presented as follows:
Select the table to enlarge. ![]()
Coming next…
You now know how to apply the statistical concepts we covered earlier to evaluate a statistical table and produce a Conceptual Data Model. Next, we’ll look at how we extend this Conceptual Data Model to produce a Logical Data Model.