Unit 2: Review of Structural Modelling for Statisticians

In this unit, you’ll review of concepts covered in the Introduction to Structural Modelling for Statisticians module.
Statistical characteristics
Before we focus on Concept Mapping and producing Your First SDMX Structural Model, let’s review a few statistical concepts used for describing and defining macro statistics.
A statistical characteristic is:
- a statistical measure applied on
- the values of one or more statistical variables
- for the objects in a certain statistical unit.
So, what does this mean? Select each term to find out.
A statistical unit is an (abstract) entity in the population for which information is sought and for which statistics are ultimately compiled i.e. the counted object. Statistical units can be persons, households, geographical areas, events, etc. To identify the statistical unit, answer the question: “What is the counted object?”
A population is a complete set of a certain type of statistical unit. Whereas statistical units are abstract, populations are concrete sets of objects with at least one characteristic in common.
A statistical measure is a summarising (aggregation) function like count, sum, and average, applied to objects in the population. For example: “Number of accidents per thousand of population”, the statistical measure is “Number of accident events”.
A statistical variable is a characteristic of a statistical unit which is measured or counted, such as height, country of birth, grades obtained at school, or income.
Statistical variables have a variable type and a value set. A type of statistical variable which divides the population into subdomains of interest is referred to as a classification variable. For example, sex is a classification variable for the population: “Number of persons living in Canada by sex at the end of year 2022”.
Unit of measure

The unit of measure is the unit in which the statistical measure values are expressed.
The unit of measure is a quantity or increment by which something is counted or described, such as:
- kg, mm, pounds, inches, °C, °F,
- monetary unit such as Euro or US dollar,
- simple number counts or index numbers.
The unit multiplier is used to indicate if the observations are reported in units, thousands, millions, etc.
Variable types
Variable types are either categorical or numerical.
Select each variable type to learn more.

Categorical variable
A categorical variable (also called qualitative variable) refers to a characteristic that can’t be quantified. Categorical variables can be either nominal or ordinal.
- Nominal: A nominal variable is one that describes a name, label or category without natural order. Sex and type of dwelling are examples of nominal variables.
Example: Variable = “Sex”, Value set = “male”, “female”. - Ordinal: An ordinal variable is a variable whose values are defined by an order relation between the different categories. “Behaviour” is ordinal because the category “Excellent” is better than the
category “Very good,” which is better than the category “Good,” etc. There is some natural ordering.
Example: Variable = “Behaviour”, Value set = “Excellent”, “Very Good”, “Good”, “Bad”, “Very Bad”.
Numeric variable
A numeric variable (also called quantitative variable) is a quantifiable characteristic whose values are numbers. Numeric variables may be either discrete or continuous.
- Discrete: A discrete variable can only assume a finite number of real values within a given interval. An example of a discrete variable would be the score given by a judge to a gymnast in competition:
the range is 0 to 10 and the score is always given to one decimal (e.g. a score of 8.5). You can enumerate all possible values (0, 0.1, 0.2…) and see that the number of possible values is finite: it is 101.
Example: Variable = “Score”, Value set = A real number greater than or equal to 0 and less than or equal to 10 with one decimal point of precision. - Continuous: A variable is said to be continuous if it can assume an infinite number of real values within a given interval. For instance, consider the height of a student. The height can’t take any
values. It can’t be negative, and it can’t be higher than three metres. But between 0 and 3, the number of possible values is theoretically infinite. A student may be 1.6321748755 … metres tall.
Example: Variable = “Height of student”, Value set = A real number greater than or equal to 0 and less than or equal to 3.
Statistical data structures

Statistical data are organised in certain typical structures, for example:
- a series of time periods (rather than a single one) – “time series data”, and/or
- a structured set of object populations (rather than a single one) – “cross-sectional data” (census data is a good example).
Review of Logical Models
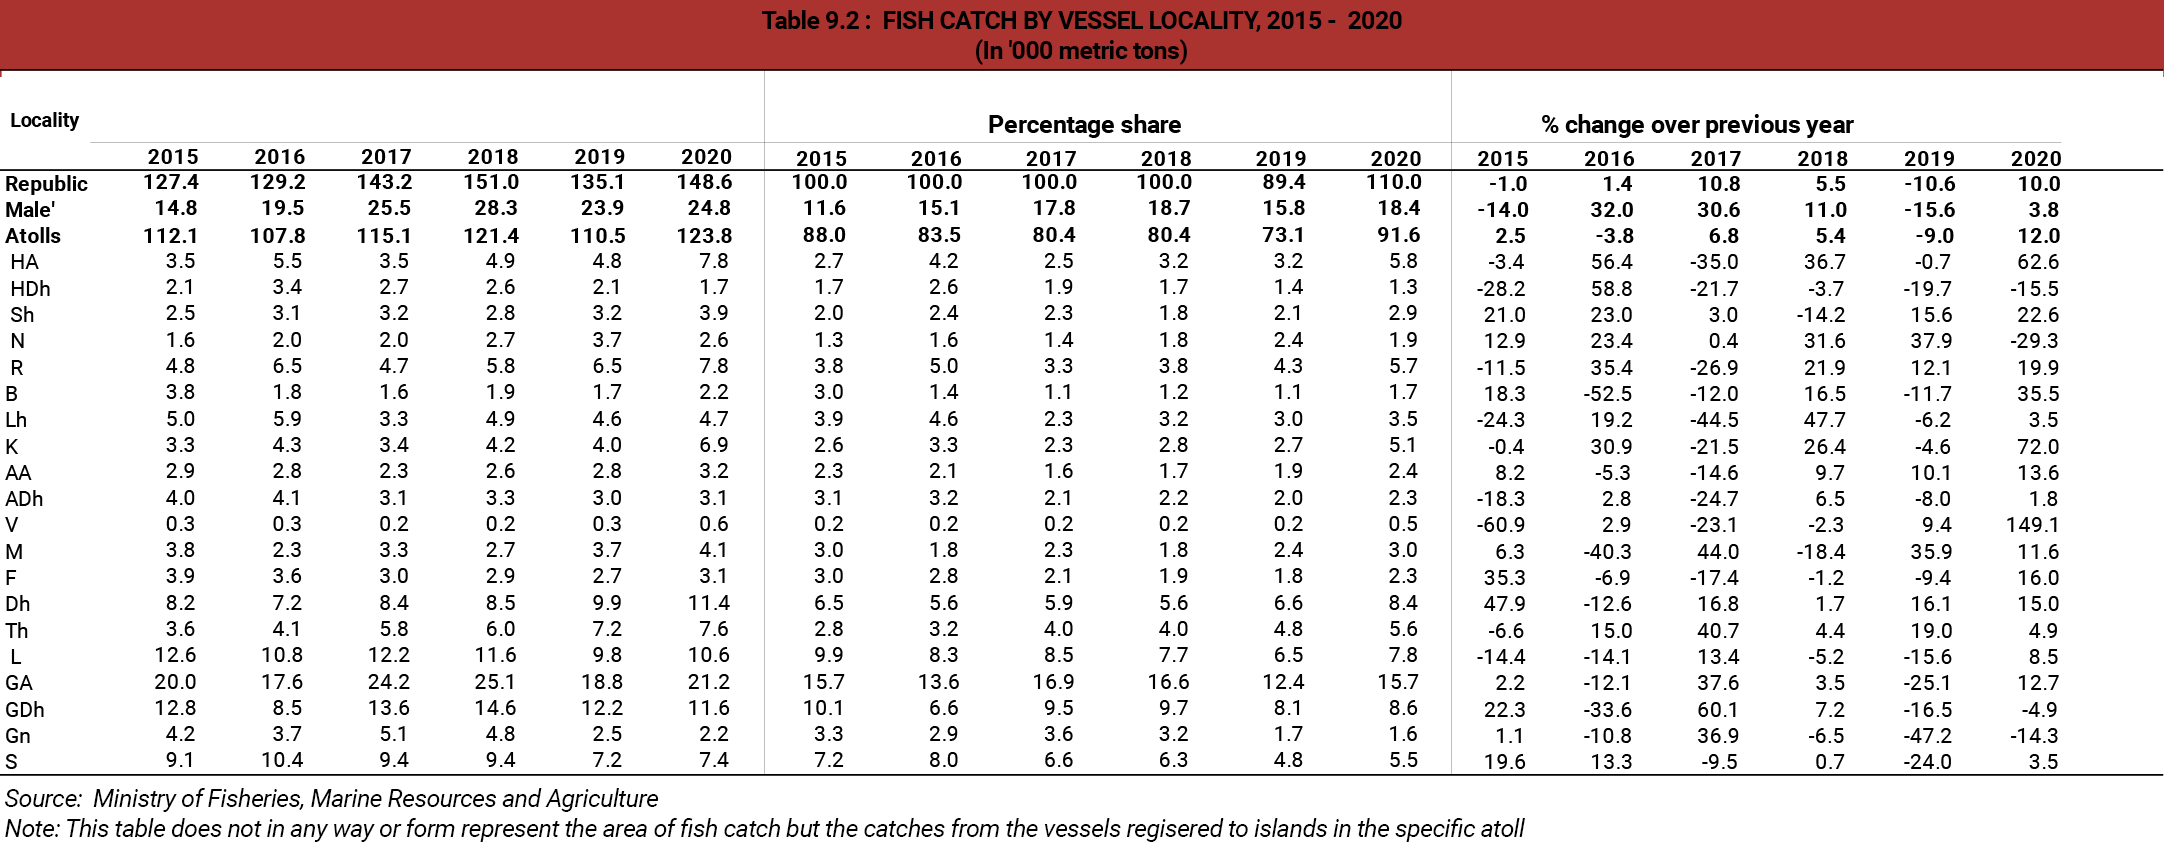
To help reinforce the learning in the Introduction to Structural Modelling for Statisticians module, we used a table from the Statistical Yearbook of the Republic of Maldives, TABLE 9.2: FISH CATCH BY VESSEL LOCALITY, 2015-2020.
Select the table to enlarge. ![]()
We analysed the above table and produced the following Logical Data Model.
Select the Logical Data Model to enlarge. ![]()
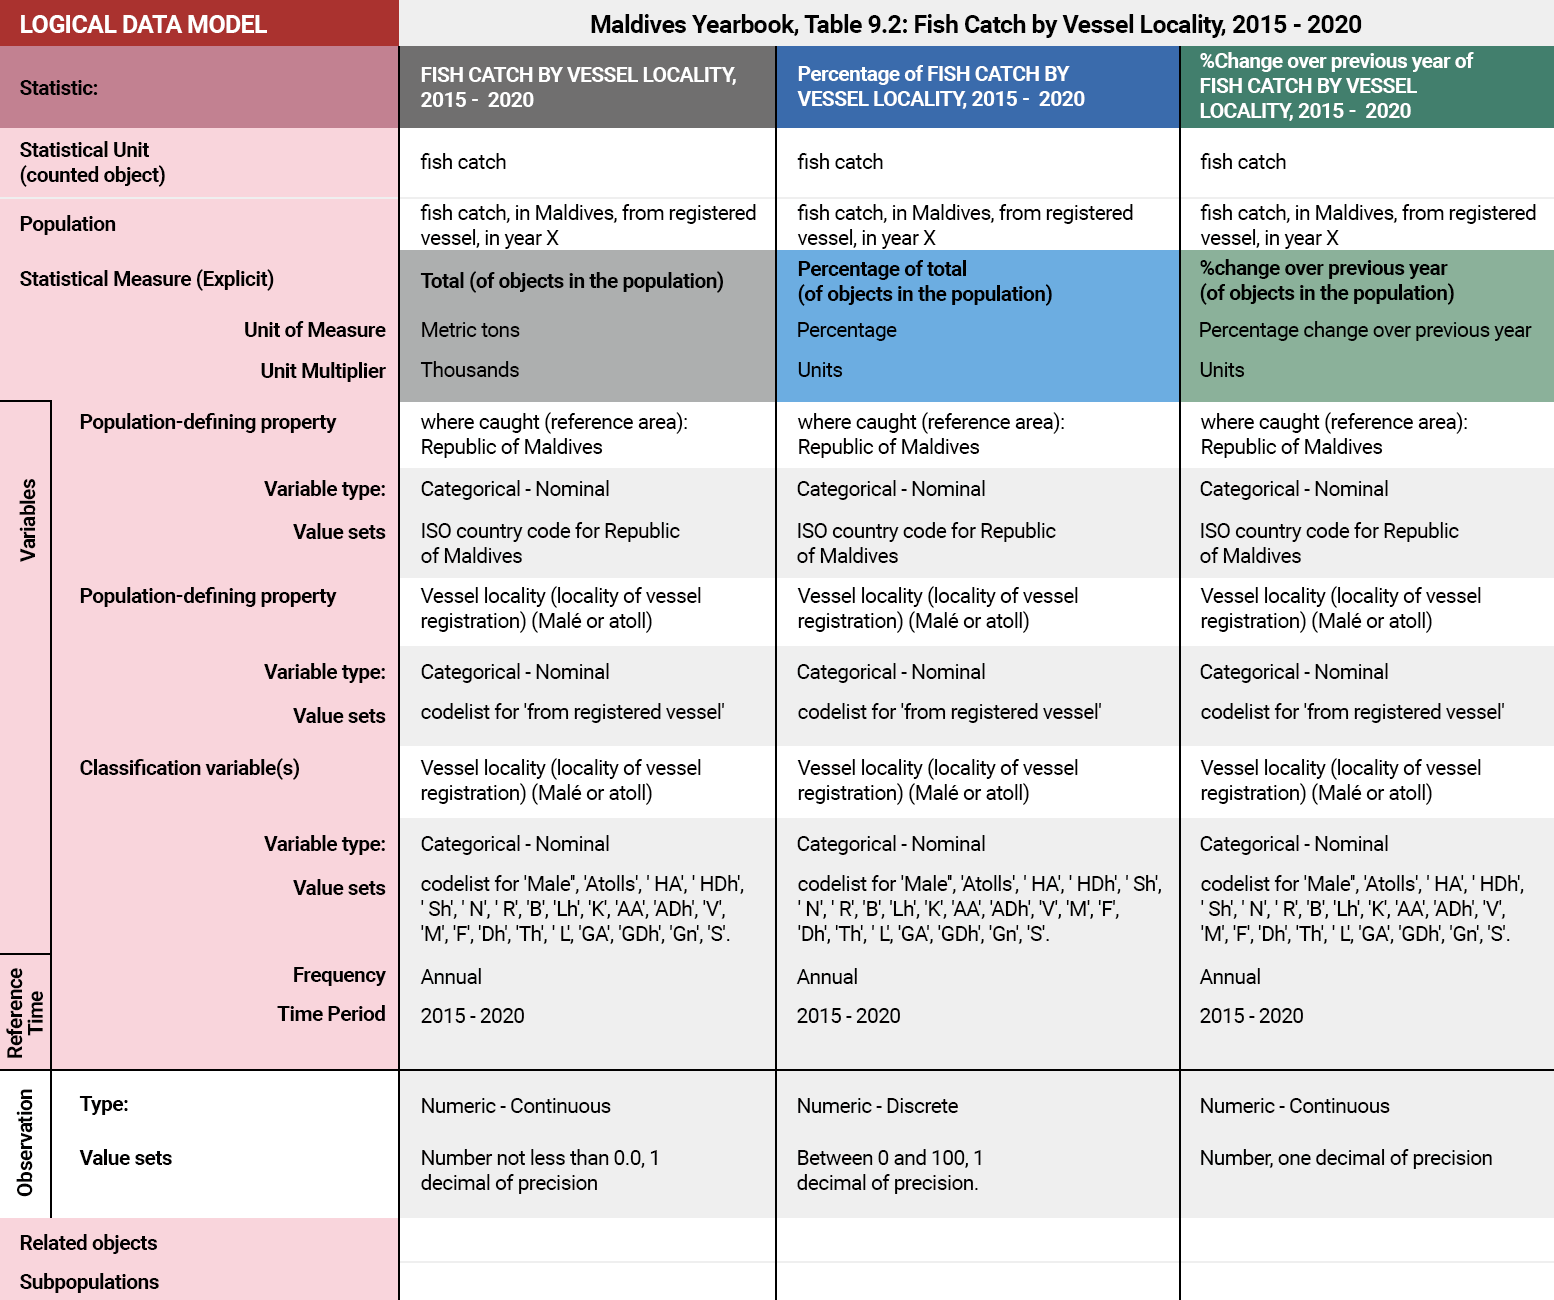
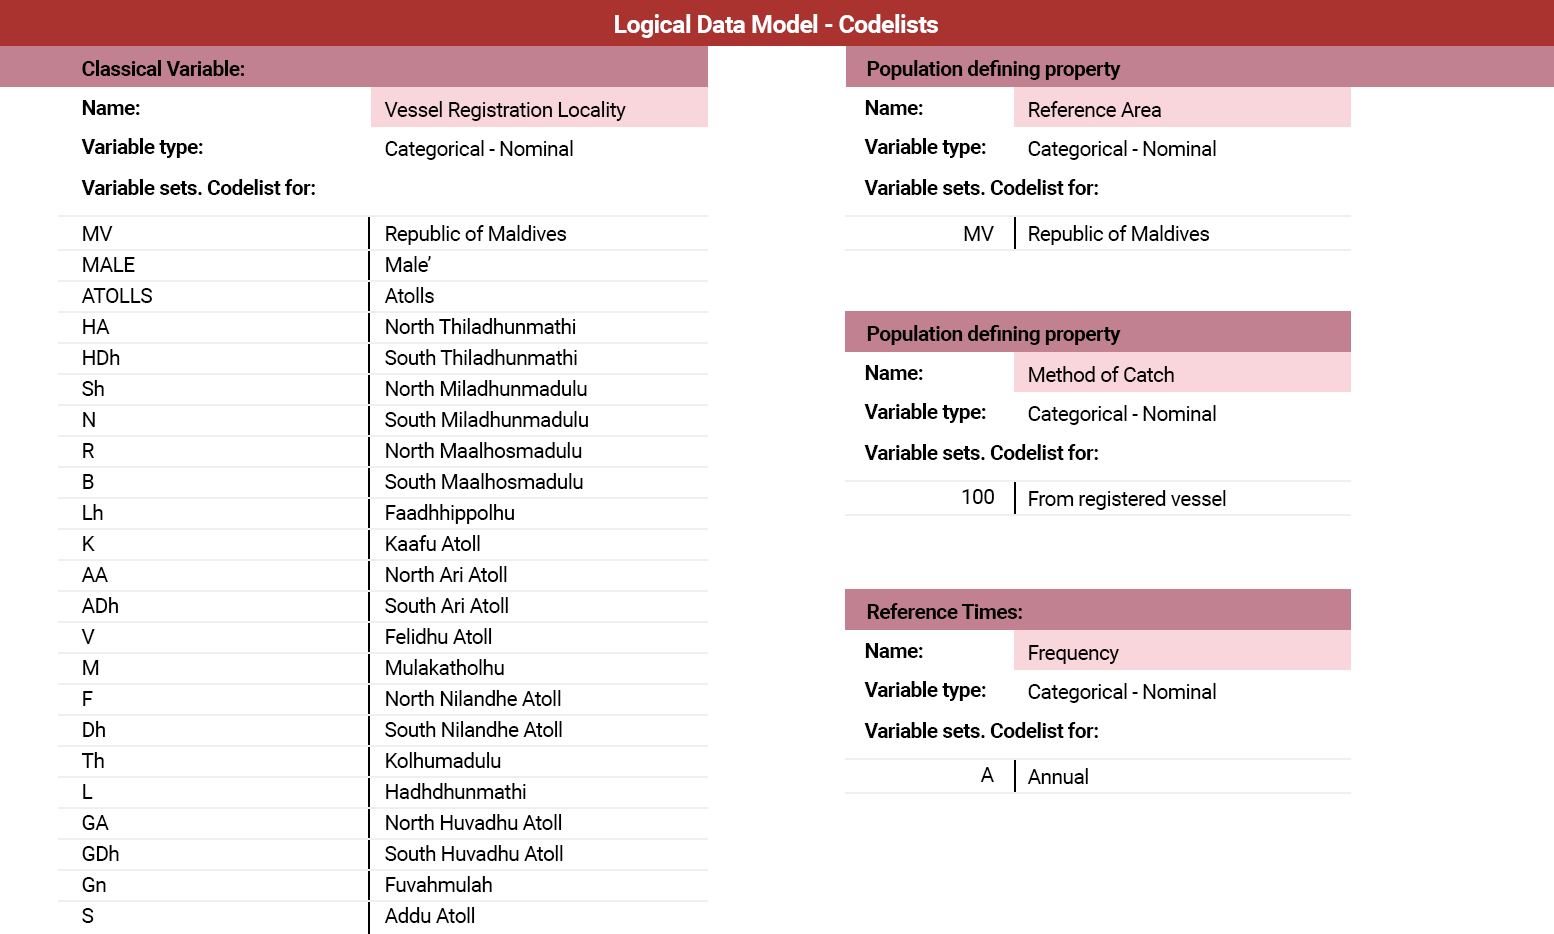
The representation of statistics in the Logical Data Model, however, has its limitations in terms of representing categorical variables with codelists. So, once this initial analytical exercise has been completed, we saw how the categorical variables had the codelists for their valuesets elaborated in a set of codelist tables for ease of reference and ease of use.
Select the codelists to enlarge. ![]()
What do you know?
Now that you’ve completed our review of statistical definitions and concepts related to describing and defining statistical data, try this.
Which of the following statements about what you have just learned are TRUE?
Select all that apply and then select Submit.
Statistical units are abstract, whereas populations are concrete sets of objects with at least one characteristic in common.
Statistical measure is a summarising (aggregation) function like count, sum, and average applied to objects in the population.
Unit of measure is a quantity or increment by which something is counted or described.
Statistical variable is a characteristic of a statistical unit which is measured or counted. Variable types are either categorical or numerical.
Coming next …
This concludes the content review phase.
Throughout the remainder of this module, the Logical Data Model for our FISH CATCH BY VESSEL LOCALITY table will be mapped to the SDMX Information Model.