Unit 4: Defining Ancillary Metadata

Reporting Templates can be customised to meet the needs of a broad range of use cases.
This unit introduces advanced topics regarding Reporting Templates and provides examples of using:
- Hierarchies
- Attributes
- Validation rules
And related use cases.
Hierarchies
It is possible to use the hierarchy set in a codelist or link a dimension to a hierarchical codelist if one exists for the dimension codelist.
To use the hierarchy set in a codelist, select “Implicit” in the use-hierarchy option of the Reporting Template wizard. This setting directs the wizard to use the parent/child relationship specified in the codelist.
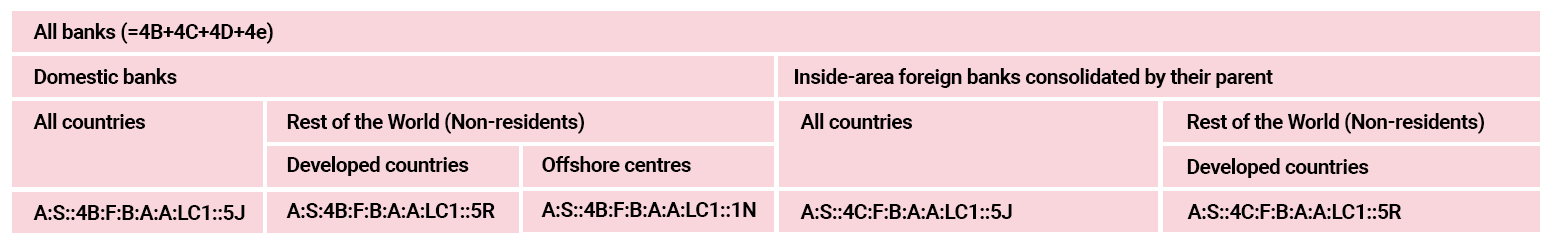
If the hierarchy is for a header dimension, and the hierarchy includes codes which are not part of the reporting universe but has child codes that are, then the code will be used as a means to group the child codes.
Select this example to enlarge.![]()
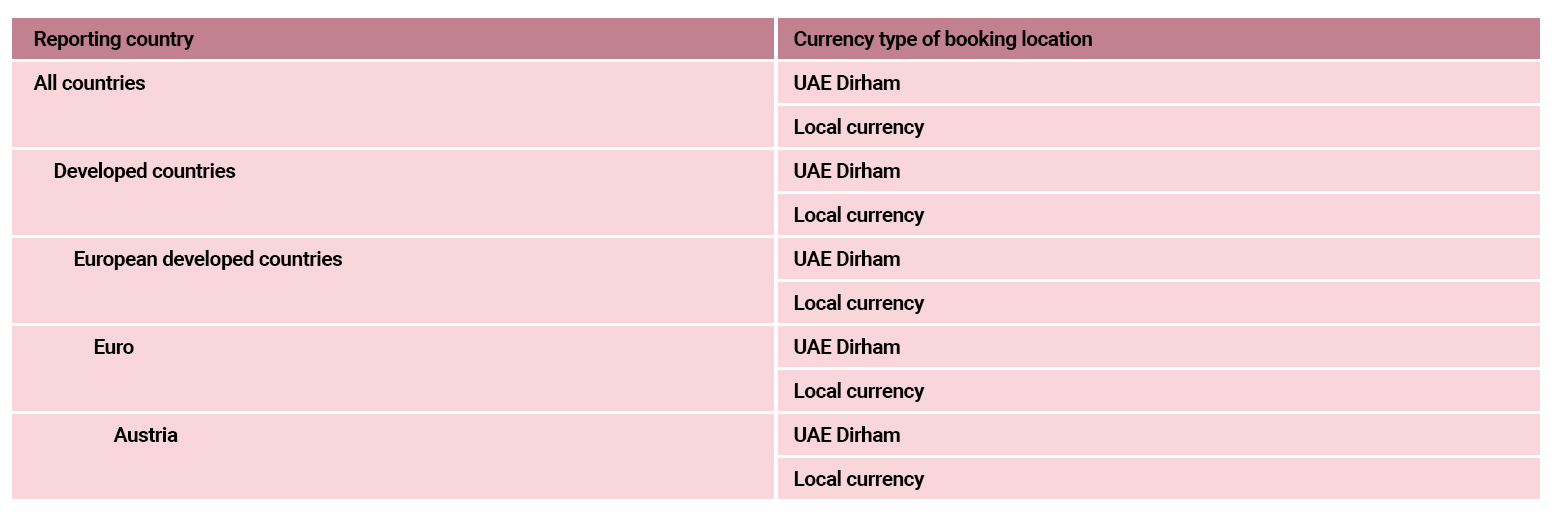
If the hierarchy is for a row dimension, then the labels will appear in the same order as the hierarchy and will include a small indentation.
Select this example to enlarge.![]()
Attributes and attribute placement
Observation attributes can also be reported alongside the reported data. There are a number of options for how attributes are reported, and different options may be selected for different attributes.
The options are as follows:
- Exclude from report – the attribute is not output in the worksheet, and attribute value will not be read in by the FMR when processing the worksheet.
- Fix reported value – the attribute is not output in the worksheet. The attribute value will be fixed to a pre-defined value (defined in the Reporting Template definition) when read in by the FMR.
- Include in XLSX table – the attribute will be output in the XLSX table, so for each observation cell, there will be an additional cell for the user to report the attribute value.
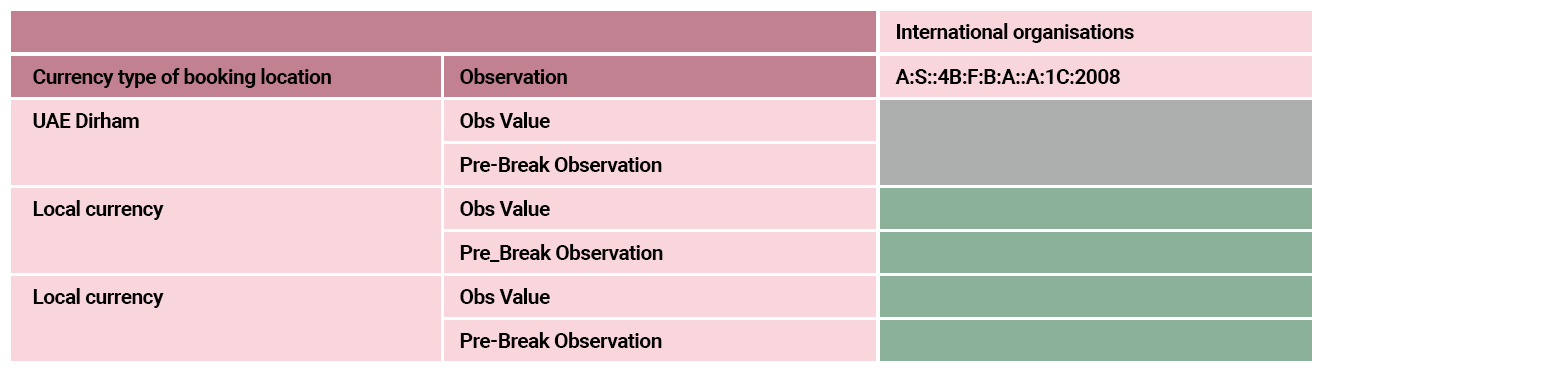
- Include in separate table – the attribute values are reported in the same worksheet as the observation table’s sheet. There is a duplicate of the observation table built under the observation table, enabling data to be reported for all the attributes set to this placement value.
- Include in separate worksheet – the attribute will be reported in a new worksheet. The table structure will be the same as the observation table.
- Conditional on reported values – the attribute value is not reported by the user but generated based on the reported values. For example, observation status could be set to missing if there is no observation reported. Another example is setting the status to break value if the observation pre-break attribute has a reported value against it for the observation.
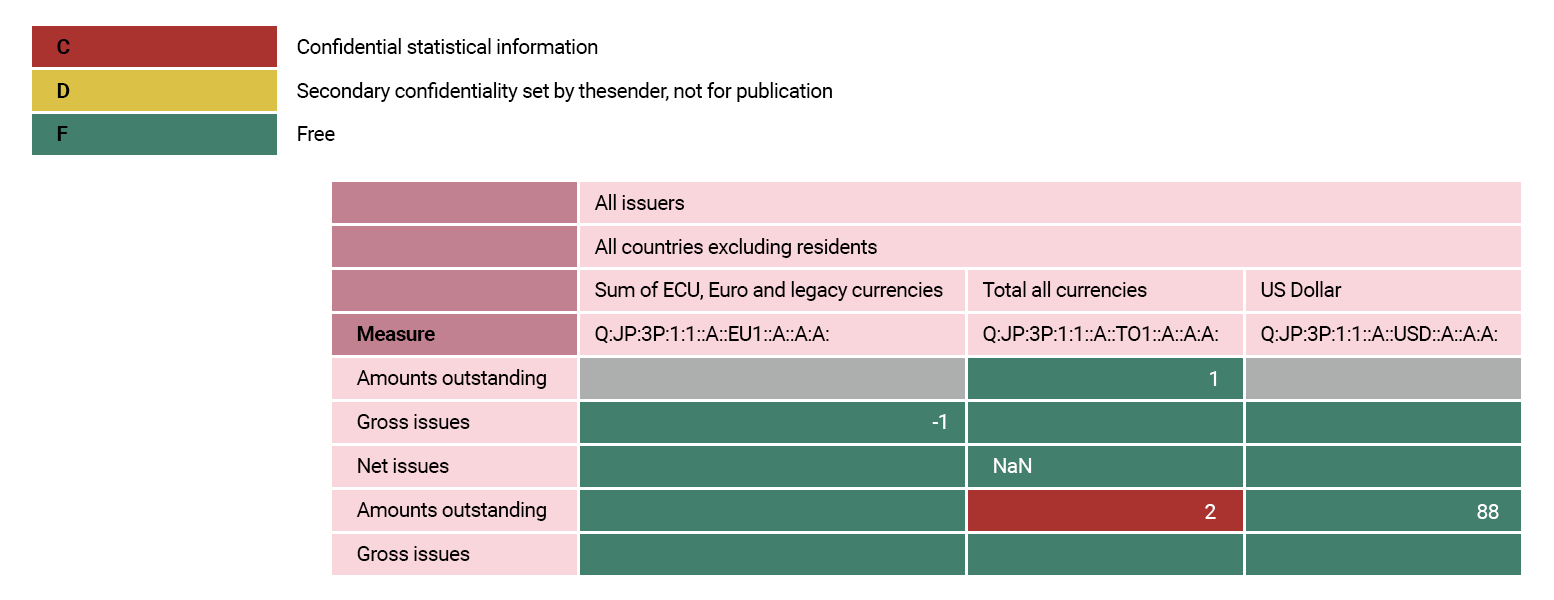
- Use colour to represent value – this option is only available for one observation attribute, and the attribute must be a coded attribute i.e. allowed values are defined by a codelist. It is possible to define one or
more codes from the codelist to a colour. For example, the observation confidentiality attribute could have:
- “Confidential” set to RED,
- “Not for Publication” set to YELLOW, and
- “Free” set to GREEN. This option will build a legend of attribute to colour in the header section of the worksheet. The data reporter can then use MS Excel’s style formatter to copy and paste the colour into the cells. When using this option, it is also possible to set both a general default colour to use, and series specific colours. For example, the default “Free” value could be set on all cells, except those for a specific currency/country (or combination) where a different confidentiality can be set. Any colour may be specified with #RRGGBB, where the RR (red), GG (green) and BB (blue) hexadecimal integers specify the components of the colour. All values must be between 00 and FF.
Select this example of observation attribute values reported using colour to enlarge.![]()
Select this example of attributes in the observation table to enlarge.![]()
Validation rules
An XLSX workbook can contain formula inputs in certain cells to pre-calculate values.
A workbook may also contain a checking table to ensure reported values are consistent with each other or meet other criteria such as lying within an expected range.
Calculations in a workbook come from Validation rules defined in a Validation Scheme.
Select below to discover more.
A validation rule is comprised of an output, and one or more inputs. For example:
- EUR = FR + DE
The output (EUR) must exist in the worksheet for the rule to be included, so too must at least one of the inputs (FR or DE). If FR or DE is not present in the worksheet, zero will be assumed.
The “set to zero” rule is also true for rules that contain other operators, for example:
- EUR = FR * DE
If FR is not present in the worksheet and the “default to zero” logic is assumed, it would result in any reported value for EUR, other than zero, to fail the rule.
It is therefore important to build the validation rules with care, or at least ensure the user who is reporting a value for EUR is not restricted from reporting the relevant inputs for this validation rule.
A checking table is an optional table which can be included on a worksheet (the inclusion is defined by the agency who creates the Reporting Template).
A checking table reports errors in the observation values of the XLSX workbook based on both the data structure’s min/max value of the primary measure, and any validation rules relevant to the data in the worksheet.
For equality errors, the checking table will report the difference between the expected value, and the reported value. For example:
- If EUR=DE+FR and the user reports 10 for DE and 10 for FR then the expected value for EUR is 20.
- If the user reports 25 for EUR, the checking table will report 5 for the cell EUR, as the reported value is 5 more than the expected value.
- For range errors, the checking table will report the identifier of the rule that has been broken.
- This identifier is set in the validation rule of the validation scheme.
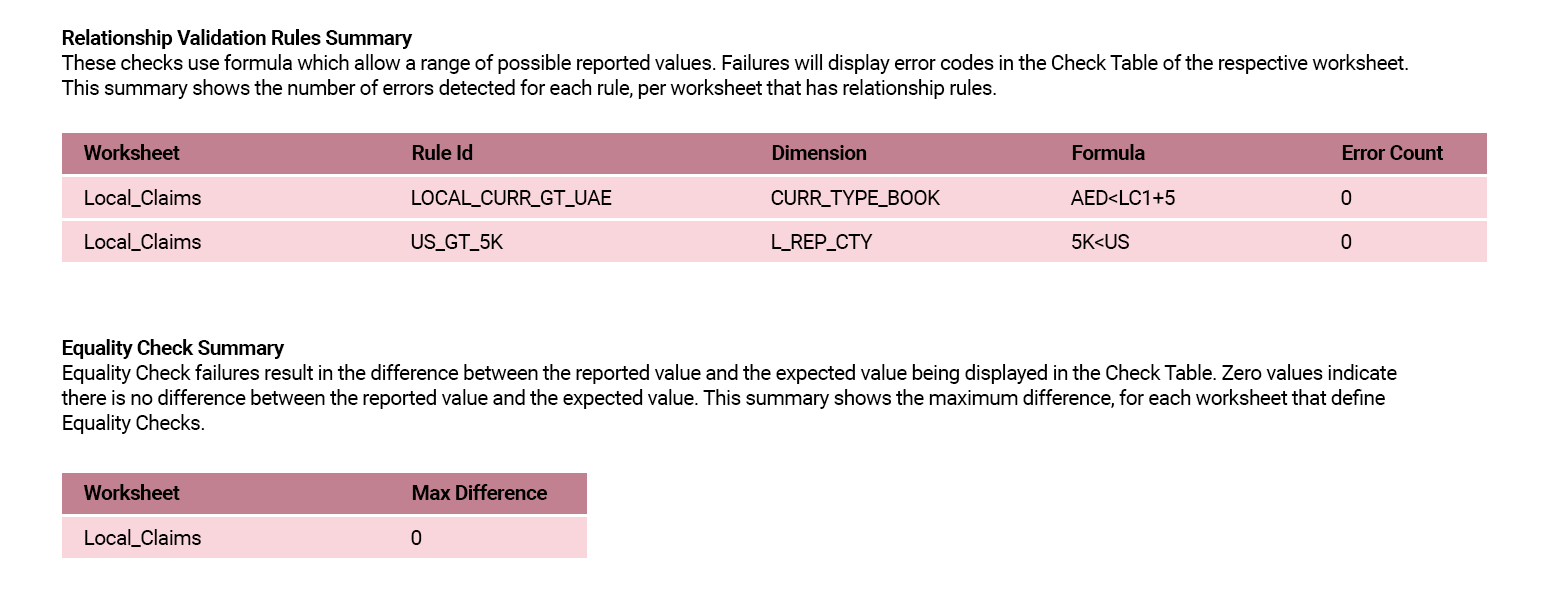
When a checking table is included in a worksheet, a checking summary worksheet is also included in the workbook. The checking summary identifies all of the validation rules and the number of errors detected for each rule – per worksheet. For range checks, it also provides the formula that was used for each rule.
Select this checking table example to enlarge.![]()
The best part is that validation rules are specified in the structural model via the validation scheme. This means that these rules can be applied to data at various stages in the data production process and regardless of whether data is provided via Reporting Templates, web services API or a combination of both, depending upon the data provider. This is extremely powerful from a coherence and data quality perspective.
What do you know?
You have now completed Data Collection with XLSX Templates: All about XLSX Templates, but before moving on to the module summary, try this final question.
Which of the following methods could you use to report observation attributes alongside the reported data?
Select all that apply and then select Submit.
There are a number of options for how attributes are reported, and different options may be selected for different attributes.
- Exclude from report – the attribute value will not be read in by the FMR when processing the worksheet.
- Fix reported value – the attribute value will be fixed to a pre-defined value when read in by the FMR.
- Include in XLSX table – there will be an additional cell to report the attribute value.
- Include in separate table – the attribute values are reported in the same worksheet as the observation table’s sheet.
- Include in separate worksheet – the attribute will be reported in a new worksheet.
- Conditional on reported values – the attribute value is generated based on the reported values.
- Use colour to represent value – define one or more codes from the codelist to a colour.