Unit 3: Defining the Universe of Data

The universe of data is determined at the time a Reporting Template is built and is based on a number of factors.
This unit describes how to specify and, if desired, constrain the universe of data in the Reporting Template.
About the universe of data
The universe of data for a Reporting Template describes the cells which will be built into, or excluded from, the data reporting form.
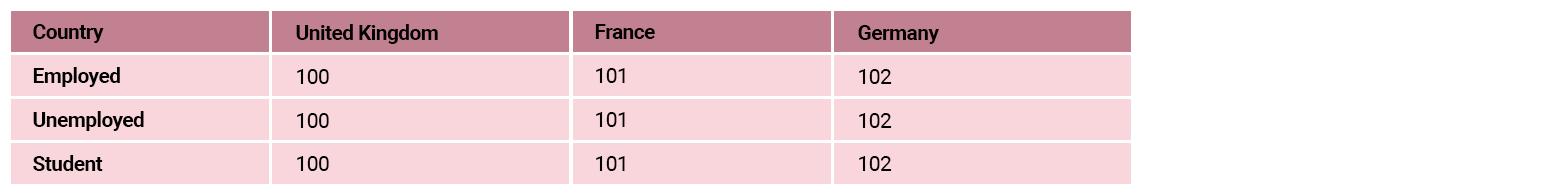
For example, if a dataflow has two dimensions, Country and Employment Status then the universe could look like this:
Select the table to enlarge.![]()
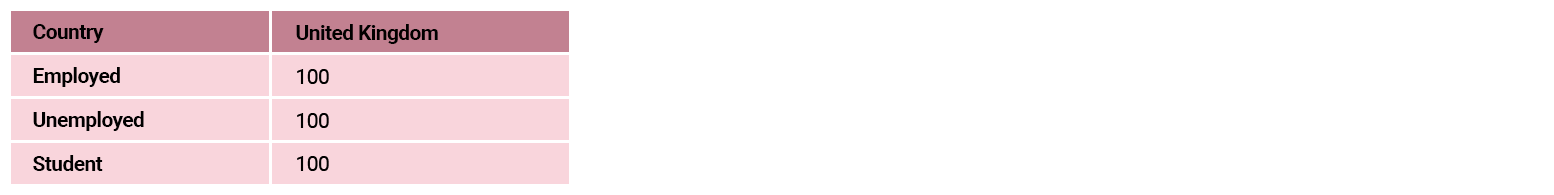
However, it may be that data is collected at the level of the Country, so each Country will have its own Reporting Template, containing only the data they are expected to provide, which for the United Kingdom (UK) could result in a universe of data that looks like this:
Select the table to enlarge.![]()
It is possible that one country does not, or is not expected to, report data on Students, so a Reporting Template for France may differ from the UK:
Select the table to enlarge.![]()

Factors determining the universe of data
The universe of data is determined at the time a Reporting Template is built, based on the dimensions set to be variable in the definition, and the following factors:
- The enumerated list of values defined by the codelist for each dimension in the dataflow (excluding the frequency and time dimension).
- The restrictions applied to these lists, based on the dataflow or data provider (content constraint).
Select each factor to reveal more.
The full universe can be calculated by multiplying the length of each codelist for each dimension defined by the data structure definition. This universe can be quite large, and generally needs further restriction by applying the second factor: Content constraints.
Note that the frequency dimension is excluded from this calculation because, when the XLSX workbook is generated, it is generated for a specific time period or range. The time period is defined using SDMX date formatting e.g. a template generated for 2002-2004 would fix the frequency for the XLSX workbook to “annual”.
For example, take a data structure with four dimensions with the given number of possible values:
- Frequency (8)
- Domain (20)
- Reference Area (240),
- Indicator (65,000)
The total reporting data universe is:
- 20 * 240 * 65,000 = 312 million cells (we do not include frequency in the calculation).
The data structure may be re-used across multiple dataflows: Central Government Debt, Trade, Balance of Payments, etc. Each dataflow only collects data for a subset of indicators and fixes the domain.
In this instance, there would be a content constraint defined to restrict domain to a single value for the Trade dataflow and restrict the indicators to only the ones which are collected for Trade e.g. 20.
The data universe is now only:
- 1 * 240 * 20 or 4,800 observation cells.
The next layer of restrictions can be applied to either the provision agreement, or data provider. When the collection is from UK organisations, the reference area dimension only allows the UK to be reported. Now the XLSX file will only contain:
- 20 cells for the United Kingdom to complete for the Trade collection.
Content constraints can get quite complicated, for example partial series can be defined for both inclusion or exclusion. As such, it is possible that an XLSX worksheet will contain cells which should not have observations reported against. In this case, the cell will be hashed out, and non-editable.
Fixed values
When an XLSX file is generated for a specific data provider, some dimensions may result in fixed values.
For example:
- If the reporting country dimension is restricted to one country for a data provider, the default is to place the fixed value in the header section of the worksheet.
- However, it is also possible to configure the worksheet to exclude (or hide) any number of dimensions from the worksheet if they have a fixed value.
- The value will still be read back in when the FMR imports/converts the file, but it won’t appear on the worksheet.
What do you know?
The universe of data is determined at the time a Reporting Template is built, and depends on which of the following factors?
Select all that apply and then select Submit.
The universe of data is determined at the time a Reporting Template is built, and is based on the following factors:
- The enumerated list of values defined by the codelist for each dimension (excluding the frequency and time dimension) in the dataflow.
- The restrictions applied to these lists, based on the dataflow or data provider (content constraint)
- The dimensions that are set to be variable in the Reporting Template’s definition
The correct answers are options 1, 3 and 5.
The universe of data is determined at the time a Reporting Template is built, and is based on the following factors:
- The enumerated list of values defined by the codelist for each dimension (excluding the frequency and time dimension) in the dataflow.
- The restrictions applied to these lists, based on the dataflow or data provider (content constraint)
- The dimensions that are set to be variable in the Reporting Template’s definition
Coming next …
Now that you’ve completed the step in the Reporting Template design workflow where we restrict the reporting universe, let’s turn our attention to the next step – Defining ancillary metadata.