Unit 2: Components of a Reporting Template

A Reporting Template is a MS Excel XLSX workbook with multiple worksheets.
- Main worksheet
- Data worksheet(s)
- Instruction worksheet (Optional)
- Checking table summary worksheet (Conditional)
The structural metadata referenced within a collection template will be associated with one or more dataflows. If these dataflows do not exist, they will need to be defined.
Reporting Template components
A Reporting Template has the same high-level properties as every other structure type in the FMR – this includes an owning agency, who is responsible for maintaining the template, an ID and a version to help uniquely identify the template.
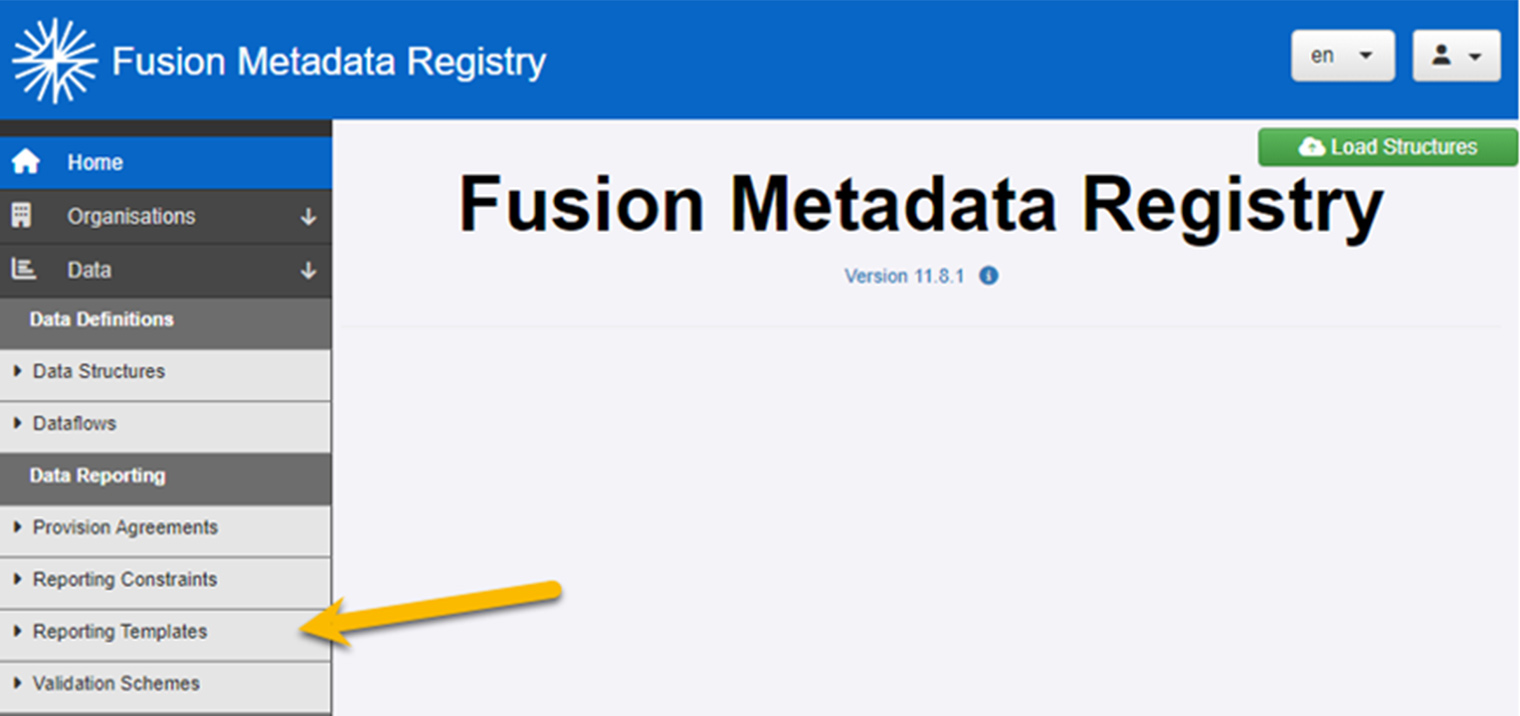
Select the diagram to enlarge.![]()
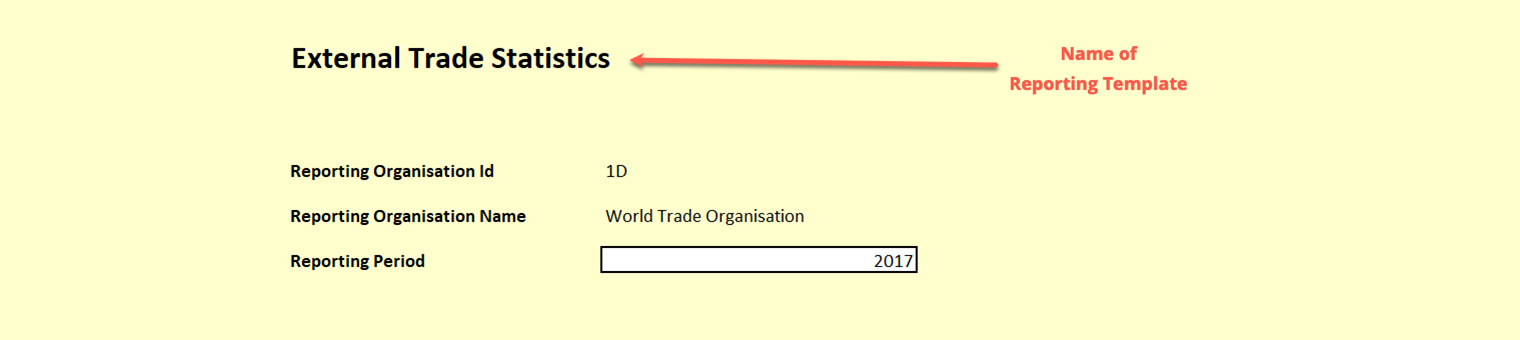
Main worksheet
The XLSX workbook is generated with a main worksheet, which contains
- the Reporting Template name,
- details of the data provider that the workbook was generated for, and
- if the Reporting Template was generated for a single period, an editable cell for the reporting organisation to complete. The reporting organisation can then reuse the same workbook for different periods, by simply changing the cell details.
The Reporting Template name is multilingual and is displayed on the main worksheet in the generated workbook.
Select this main worksheet example to enlarge.![]()
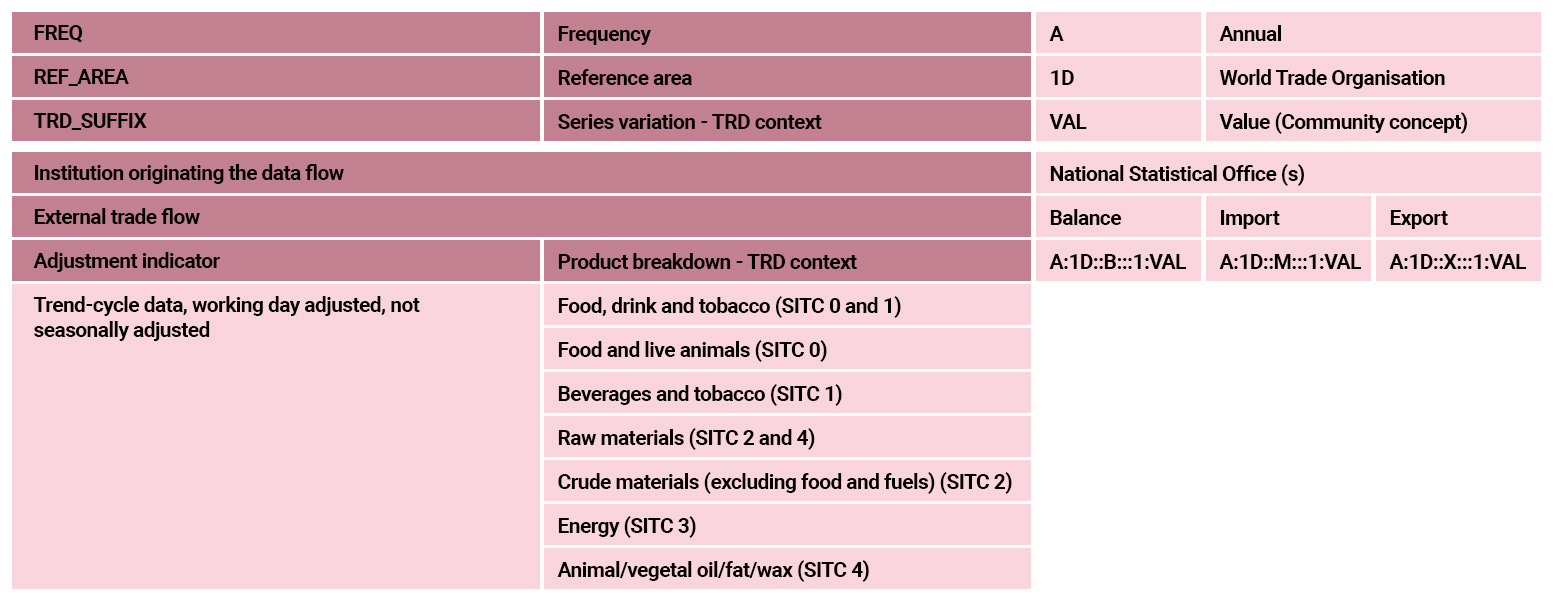
Defining the table layout
A table layout is constructed by choosing which dimensions of your data structure will appear in the table rows, and columns. You can also define the order of the dimensions.
It is also possible to choose whether the name, the ID, or both the name and ID are shown for dimensions and codes. The choices here will impact how the resulting table looks. Codes will always be output in the order of the codes in the underlying codelist unless a reporting hierarchy is used for the dimension.
Select the table to enlarge.![]()
Defining the table size
As with any data entry form, when designing a reporting template, it is important to ensure that the total table size does not grow too large. The table size can be calculated by multiplying all the possible values for each dimension. For example, a table with the following dimensions:
- FREQUENCY: A, M
- REF_AREA: UK, FR, DE
- AGE_RANGE: 0, 1, 2, 3, 4
- SEX: M, F
Would result in a table with 60 cells (2 * 3 * 5 * 2). Data structure definitions are typically much larger than this, so the possible table size can run into extremely high numbers.
There are two ways to keep table size down.
Select each method for the details.
For example, the reference area dimension may contain over 200 possible countries, but if the data provider is UK, the country can be restricted to UK.
This topic will be covered in more detail in the next unit: Defining the Universe of Data.
- Health statistics – if collecting data about diseases, the list of diseases could be a variable.
- Education statistics – the levels of education (pre-primary, primary, …) could be a variable.
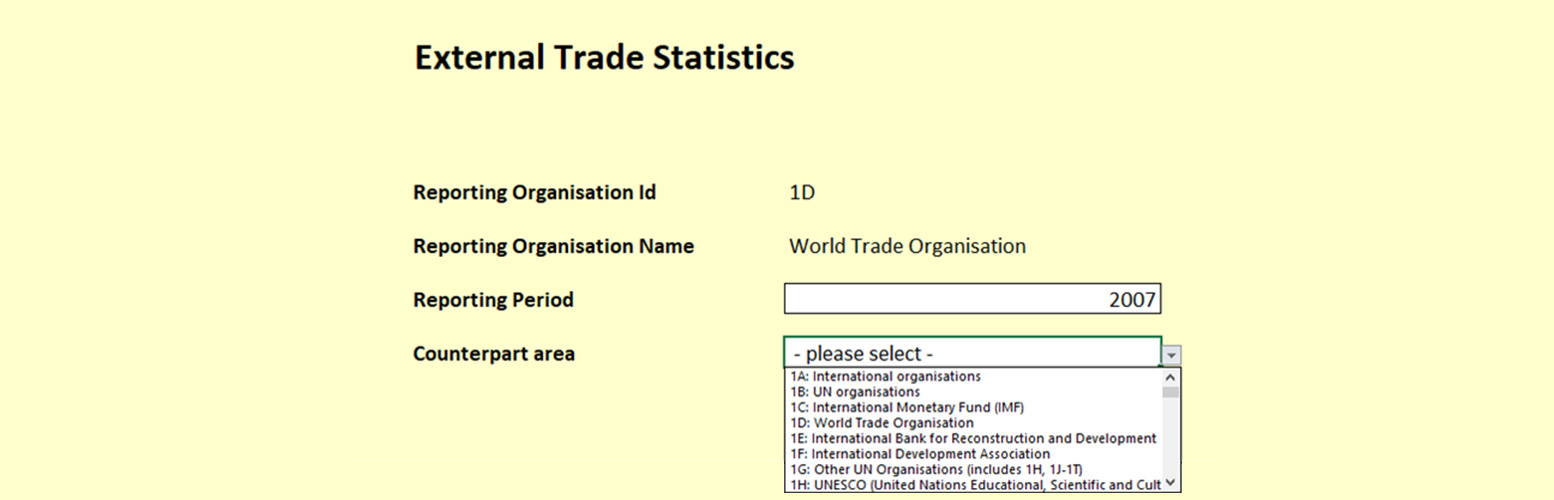
- External trade statistics – counterpart countries could be a variable.
Select this example to enlarge.![]()
Instruction worksheet (Optional)
An instruction worksheet is an optional worksheet which can be used to transmit any textual information to the data provider.
The instruction sheet content is text, with support for the following markdown syntax:
- # Heading 1
- ## Heading 2
- ### Heading 3
- #### Heading 4
- ##### Heading 5
- ###### Heading 6
NOTE the space after the # symbol for all headings above.
- *italic*
- **bold**
- ***bold and italic***
- \n New Line (or alternatively enter a carriage return when typing the text using the Reporting Template wizard) *
Select this instruction worksheet example to enlarge.![]()
Checking table summary worksheet (Conditional)
If data validation rules exist in the FMR against the dataflow, these rules will be written as MS Excel formulas in the data worksheet.
A read only checking table summary worksheet will be included which contains a high-level summary of rules that exist, and which rules have been violated i.e. where the reported value does not match the value expected from the mathematical expression.
What do you know?
Now that you’ve looked at the components of a Reporting Template, try this.
A Reporting Template is a MS Excel XLSX workbook with multiple worksheets. Which of these worksheets can be used to transmit textual information to the data provider?
Select your answer and then select Submit.
An instruction worksheet is an optional worksheet which can be used to transmit any textual information to the data provider.
The correct answer is option 3.
An instruction worksheet is an optional worksheet which can be used to transmit any textual information to the data provider.
Coming next …
In the next unit you’ll learn how the “universe of data” for a Reporting Template describes what cells will be built into, and excluded from, the data reporting form.