Simplifying Data Collection thru Dissemination using open source tools and SDMX
Introduction
This article demonstrates an integrated workflow from data collection through dissemination using open source tools and a data model implemented in SDMX. It illustrates the benefits of processes and systems designed around a common data model and how this can improve data quality and efficiency in organisations of all sizes. The article is oriented towards statistical officers working in data production and dissemination although anyone working with data, statistician or IT specialist, may benefit.
How difficult is it to create a simple end to end collection thru dissemination process using a common data model and open source tools? How significant is the effort to transform the data model for use in one tool vs another? How much technical effort is required of IT staff to support daily data operations tasks? In an ideal situation, the integration and transformation effort would be minimal (or non-existent) and the same would hold true for IT staff involvement in daily data operations. How close can we get to achieving these objectives?
To demonstrate what is possible, we are going to mock up a data collection through data dissemination process for a public dataset.
Getting started - defining the data model
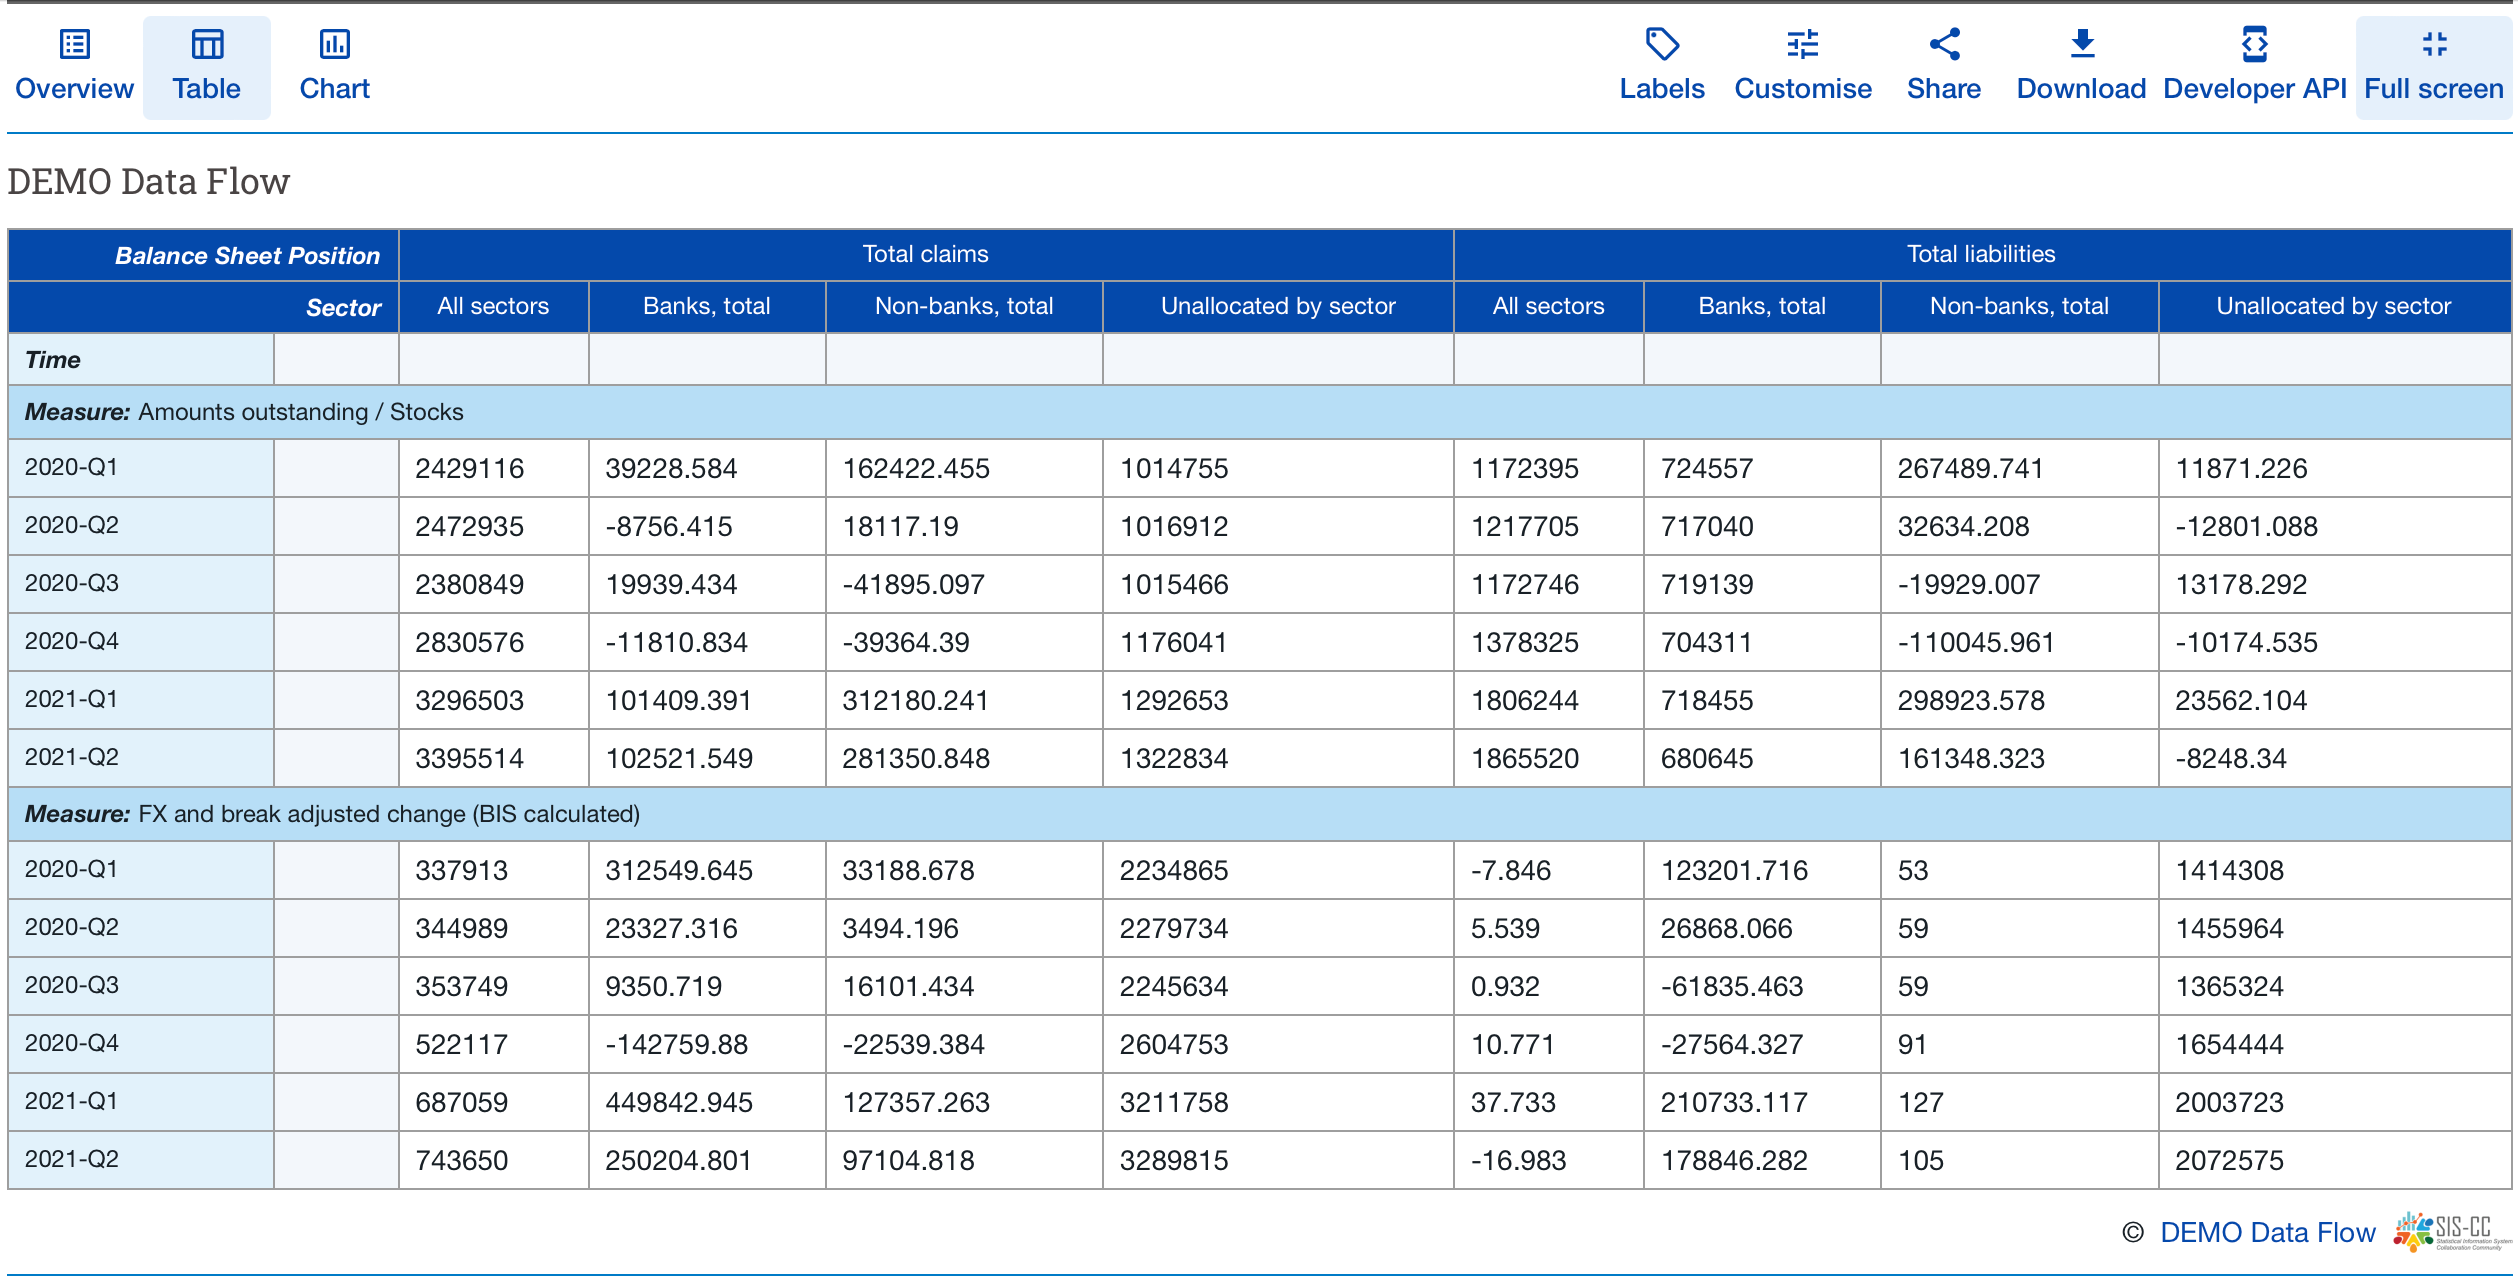
Let’s begin by choosing a public dataset from the Bank for International Settlements (BIS) data portal to use for our demonstration of collecting data from a data provider to publishing it in a data portal:
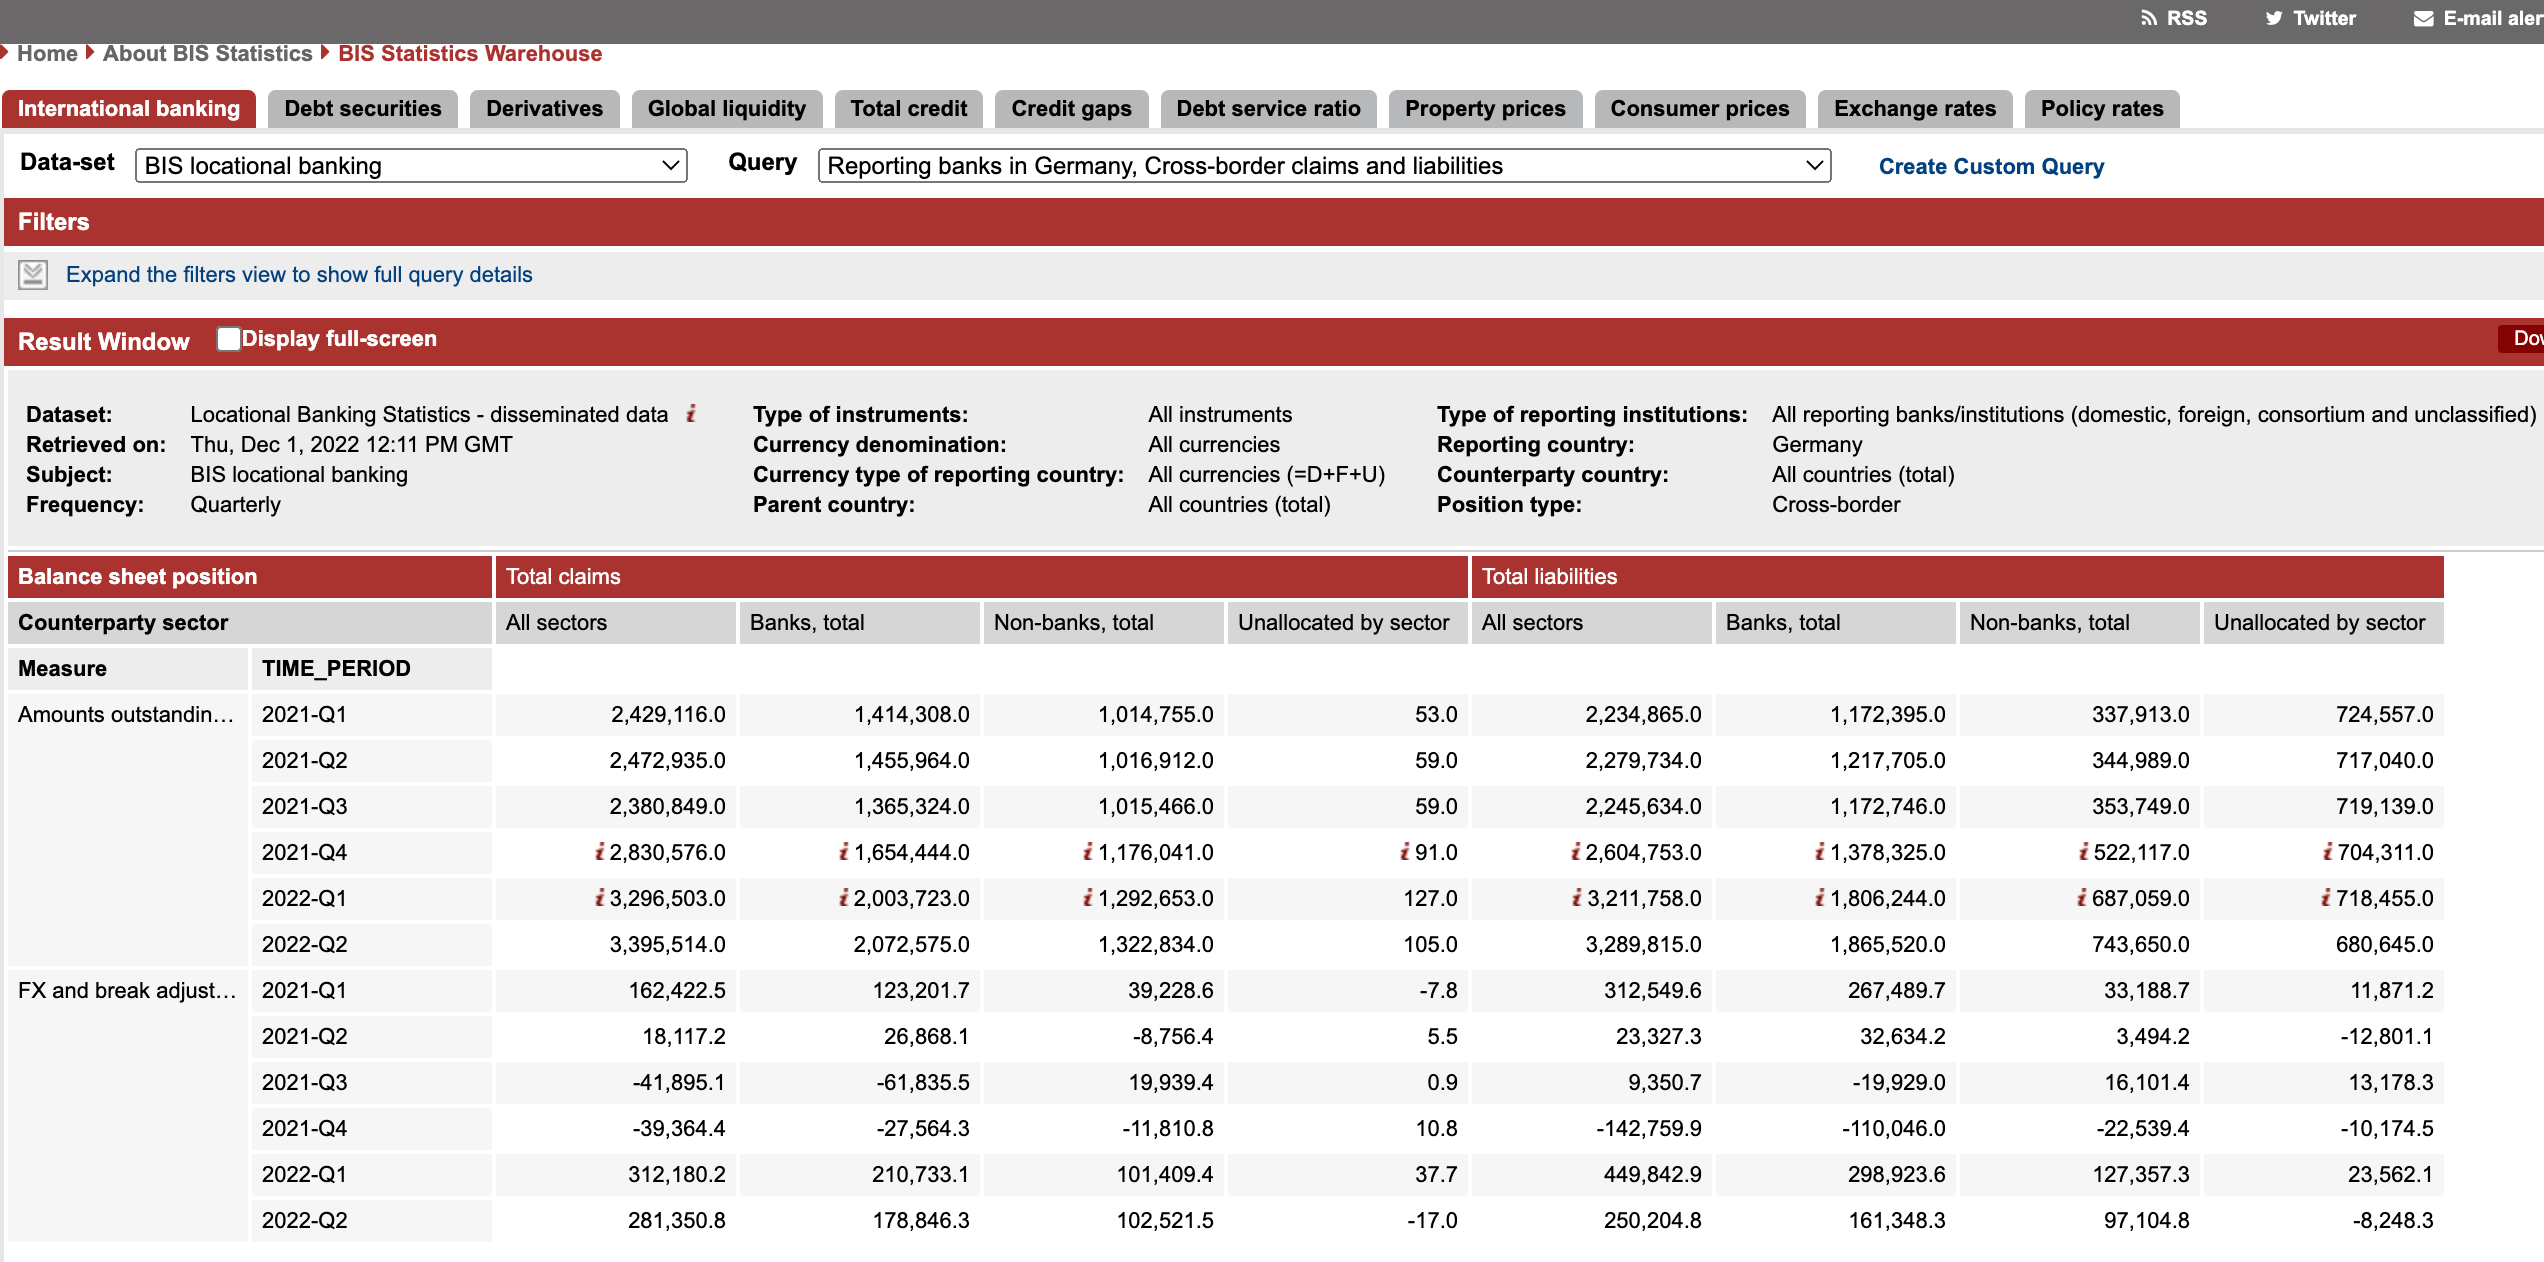
The presentation of data in tabular format in a data portal or dissemination website is one way to view data. A data custodian may choose to present the data very differently in a data collection tool or in internal data production and analysis tools or in a range of infographics and visualisations. The SDMX information model supports these use cases.
The SDMX information model, amongst other things, permits pivoting, combining, and laying out data in many different ways depending upon the specific objective of individual processes and outputs.
A simplified version of the data model for the above table can be described by stating that each data point in this table:
- Has a quarterly time period reference.
- Is either an “Amount Outstanding” or “FX and break adjustment” Measure.
- Has a Balance Sheet Position of either Total Claims or Total facilities.
- Is in one of the following sectors: “all sectors”, “banks, total”, “non-banks, total”, “unallocated by sector”.
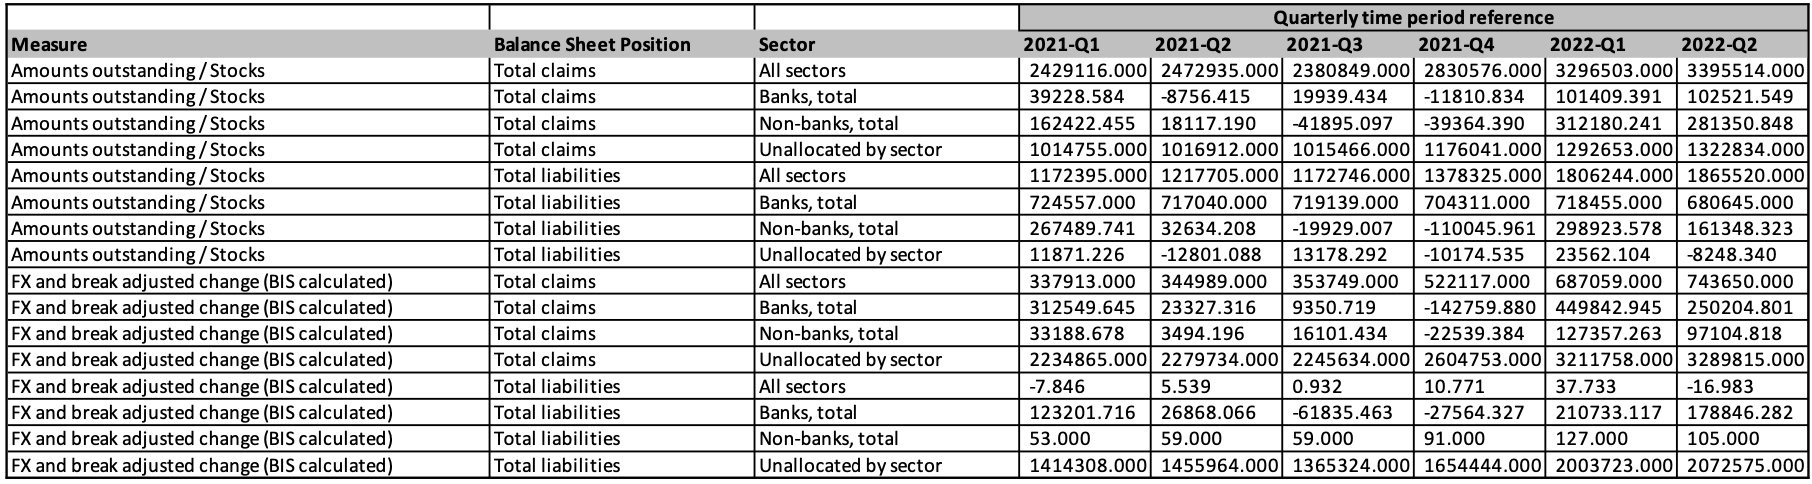
A flattened view of this data might look like the following:
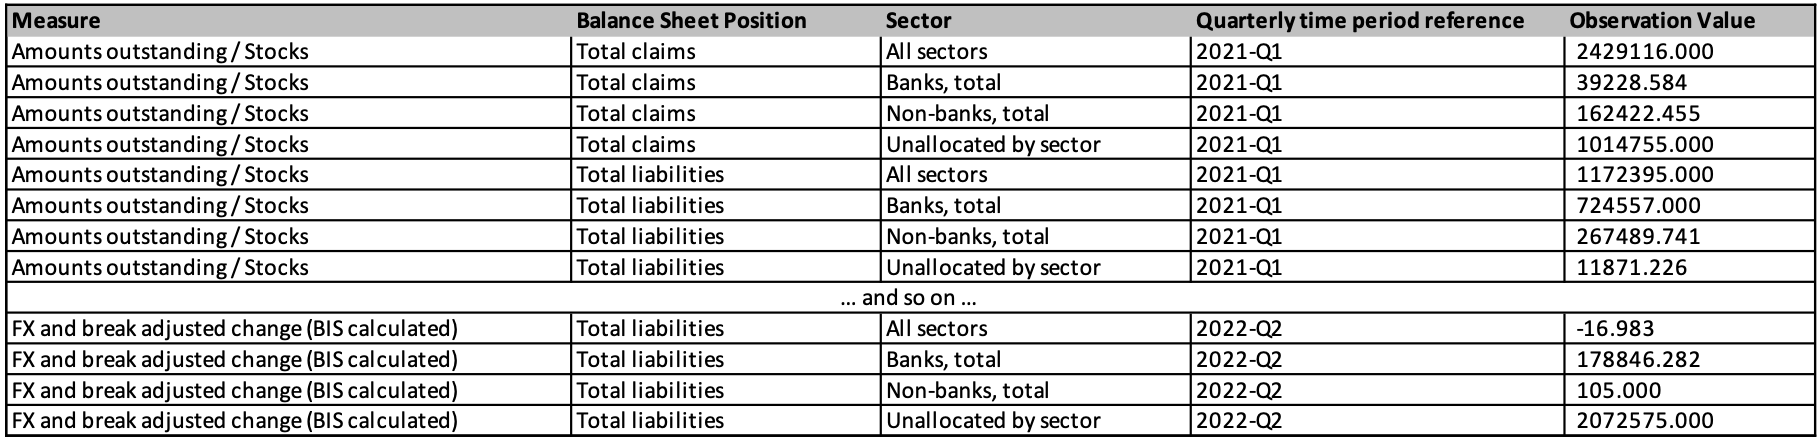
And if we further flatten the quarterly time period, we end up at our goal of one observation per row, and a data table that is fully described by a data model:
There are a few key observations to note regarding the data in the table published on the BIS data portal:
- The original table indicates that the data is being reported by Germany.
- The content is unilingual English.
- Data processing will be limited to validation.
We will also keep this demonstration less verbose by removing the annotations and other metadata and we will keep it simple by excluding the discussion of norms and good practices. These topics will be addressed in future articles.
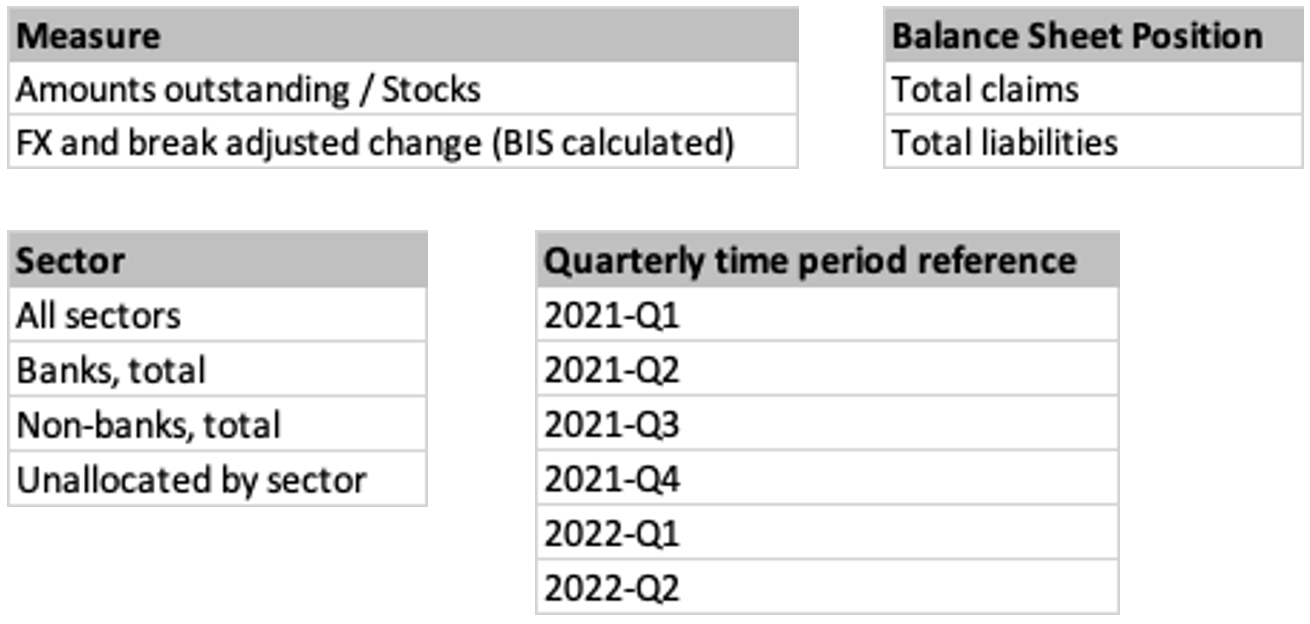
The essential information that makes up our data model is contained in the following four lists:
Storing the data model in FMR
Now that we have our data model, lets revisit our core objective which is to improve data production by applying digital methods and tools. We want to use open source tools and our data model in order to collect the data using an MS Excel template, apply a number of data validation checks to the data file received, and then publish the data in a data portal.
In order to use the data model to drive the software systems and processes, the model needs to be input into the systems. The first open source software we will use is Fusion Metadata Registry (FMR). FMR will allow us to:
- Describe our data model in a tool.
- Ensure that our model is compliant with the SDMX standard.
- Use our model to create a template-driven excel questionnaire for data collection from a respondant.
- Validate the data returned by the respondant.
- Transform the respondent data into a format compliant with .Stat Suite and export the file.
- Transform our model into a format compliant with .Stat Suite and export the file.
Installation of FMR using Docker Desktop is very straightforward and extremely simple. The installation is explained very well in the following article: https://fmrwiki.sdmxcloud.org/Quick_start_guide_-_Deploy_as_a_Docker_Container , including the installation of Docker Desktop.
TIP: The .Stat Suite kubernetes service is installed on port 8080. By default, FMR also installs on port 8080 which results in a conflict. Refer to this article https://hub.docker.com/r/sdmxio/fmr-mysql for instructions on how to create FMR instances on other (not 8080) ports.
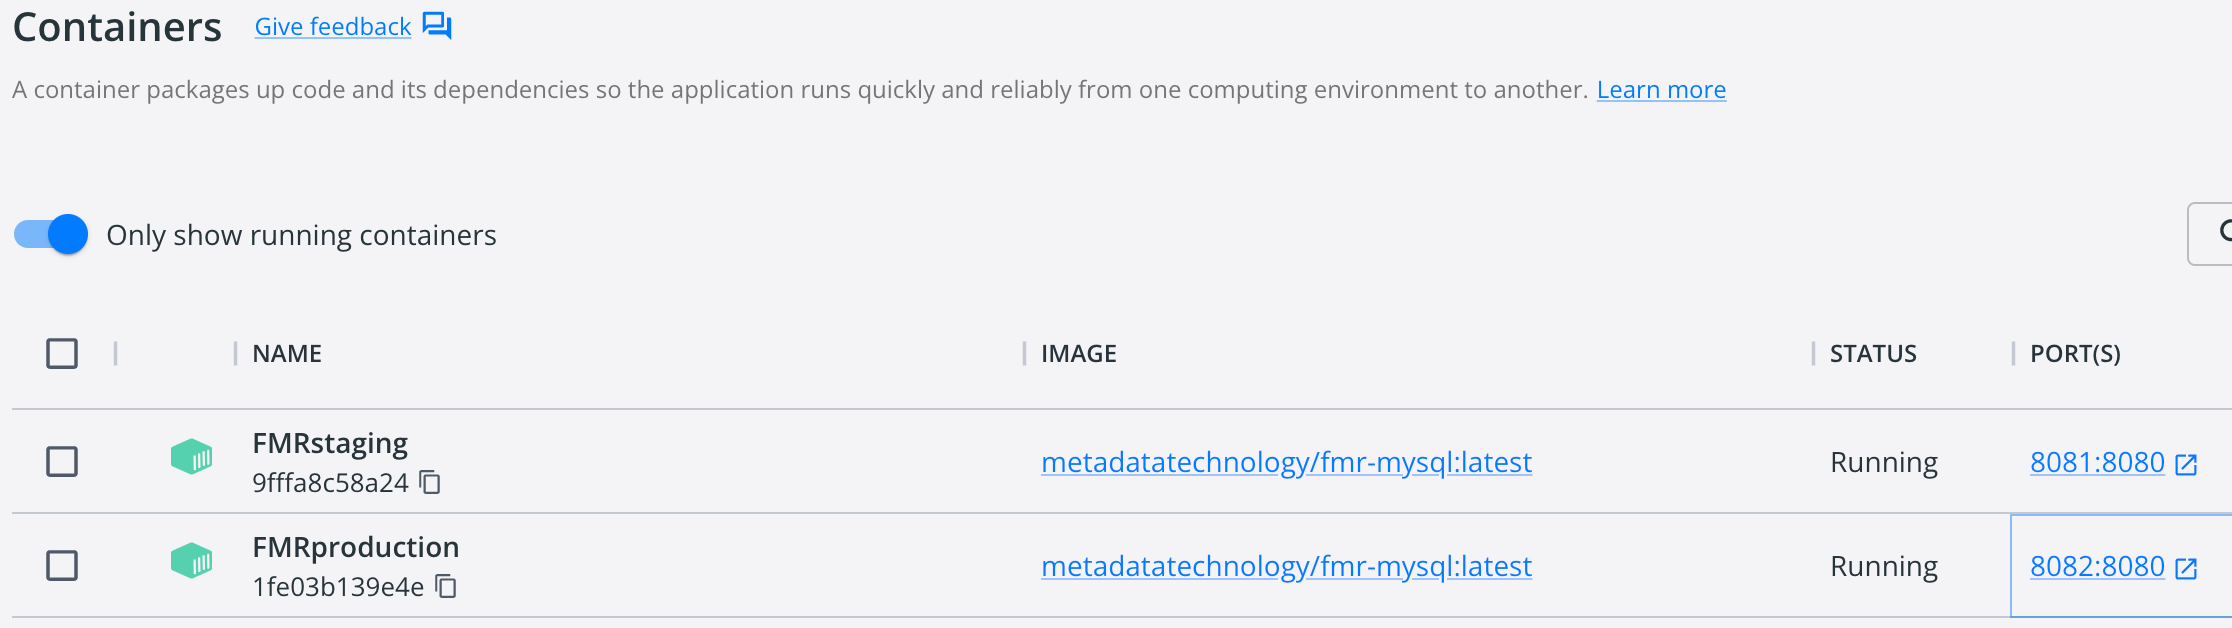
TIP: You can install multiple FMR instances on the same computer, for example, you can install an FMRstaging instance on port 8081 and an FMRproduction instance on port 8082. Each instance of FMR is completely independant of the others. To create these two instances, use the following commands:
docker container create --name FMRstaging --env SERVER_URL=http://localhost:8081 --publish 8081:8080 sdmxio/fmr-mysql:latest

docker container create --name FMRproduction --env SERVER_URL=http://localhost:8082 --publish 8082:8080 sdmxio/fmr-mysql:latest
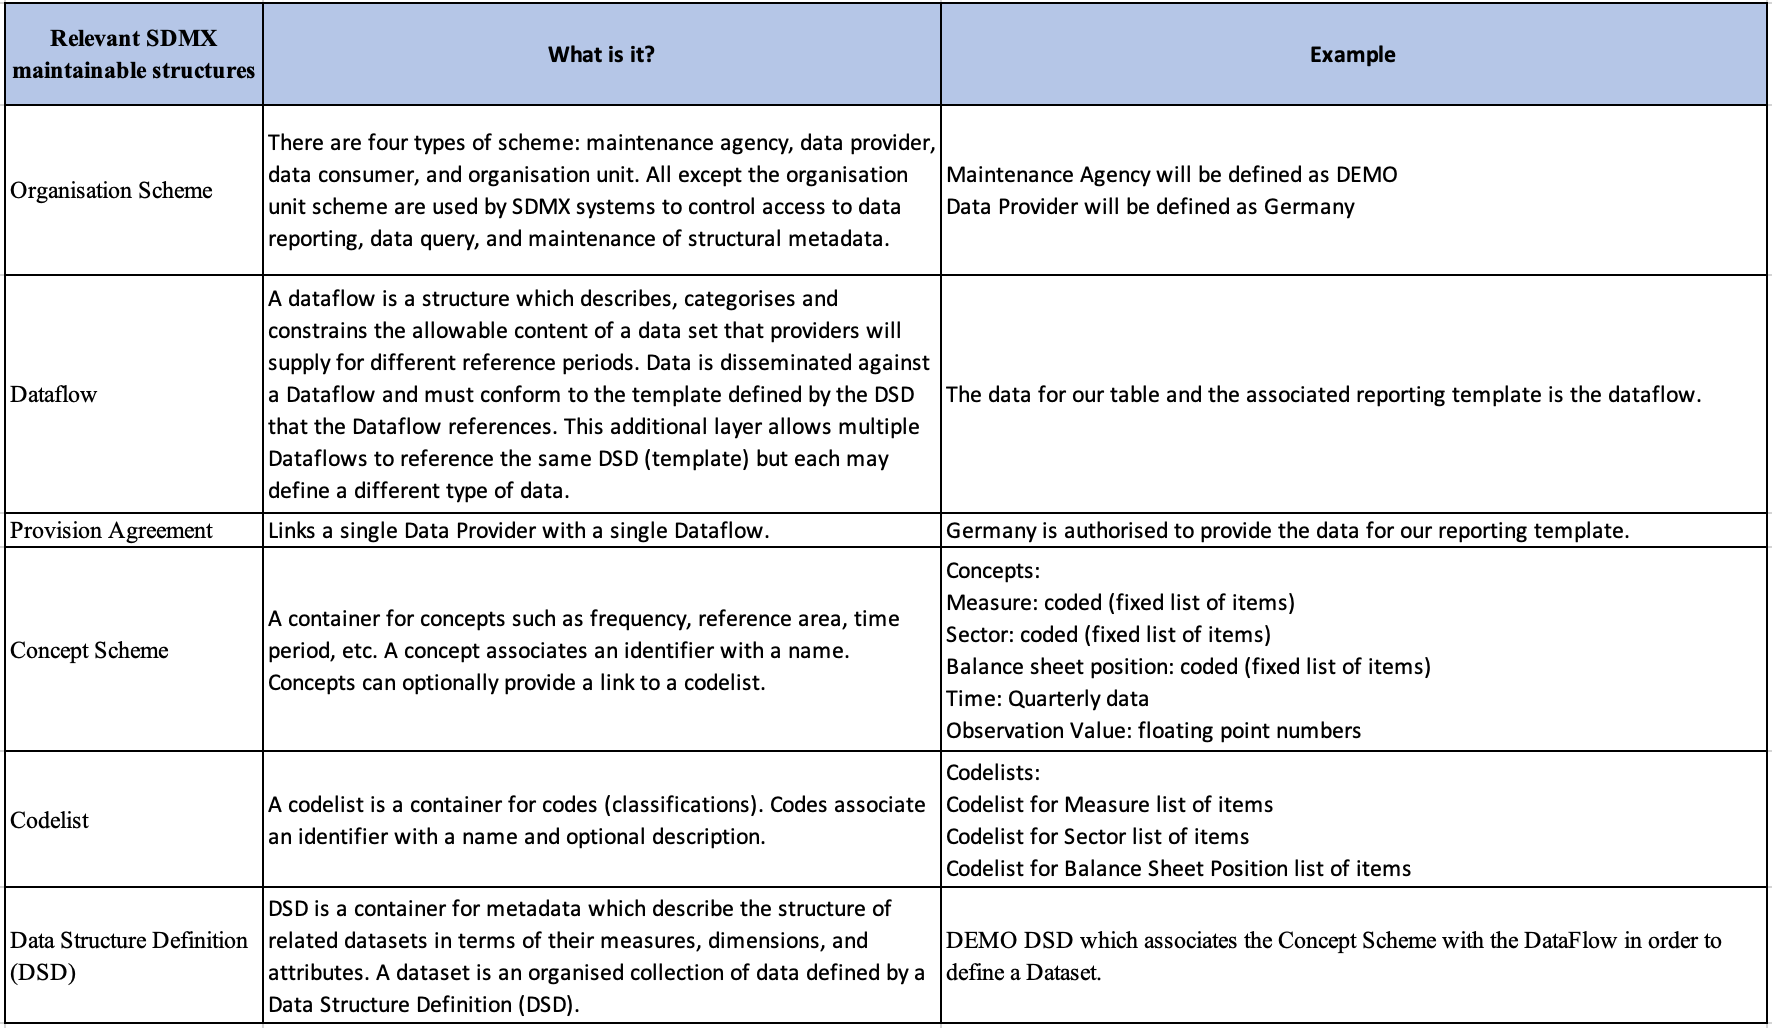
Once FMR is installed, we can use it to input the data model. Translating the data model to SDMX terminology is described in the following table with an example provided to explain the linkage between the SDMX concept and the data model. As can be seen from the definitions, SDMX is designed to accommodate large complex data production processes and modelling requirements. This complexity can be overwhelming when learning how to use SDMX for simple use cases. Hopefully, this article will demonstrate how powerful and straightforward SDMX is to use once you become familiar with the basic concepts.
This article will not demonstrate the mechanical steps of entering the data model into FMR, future elearning modules will be able to do a much better job of addressing this requirement.
Creating an Excel data collection template
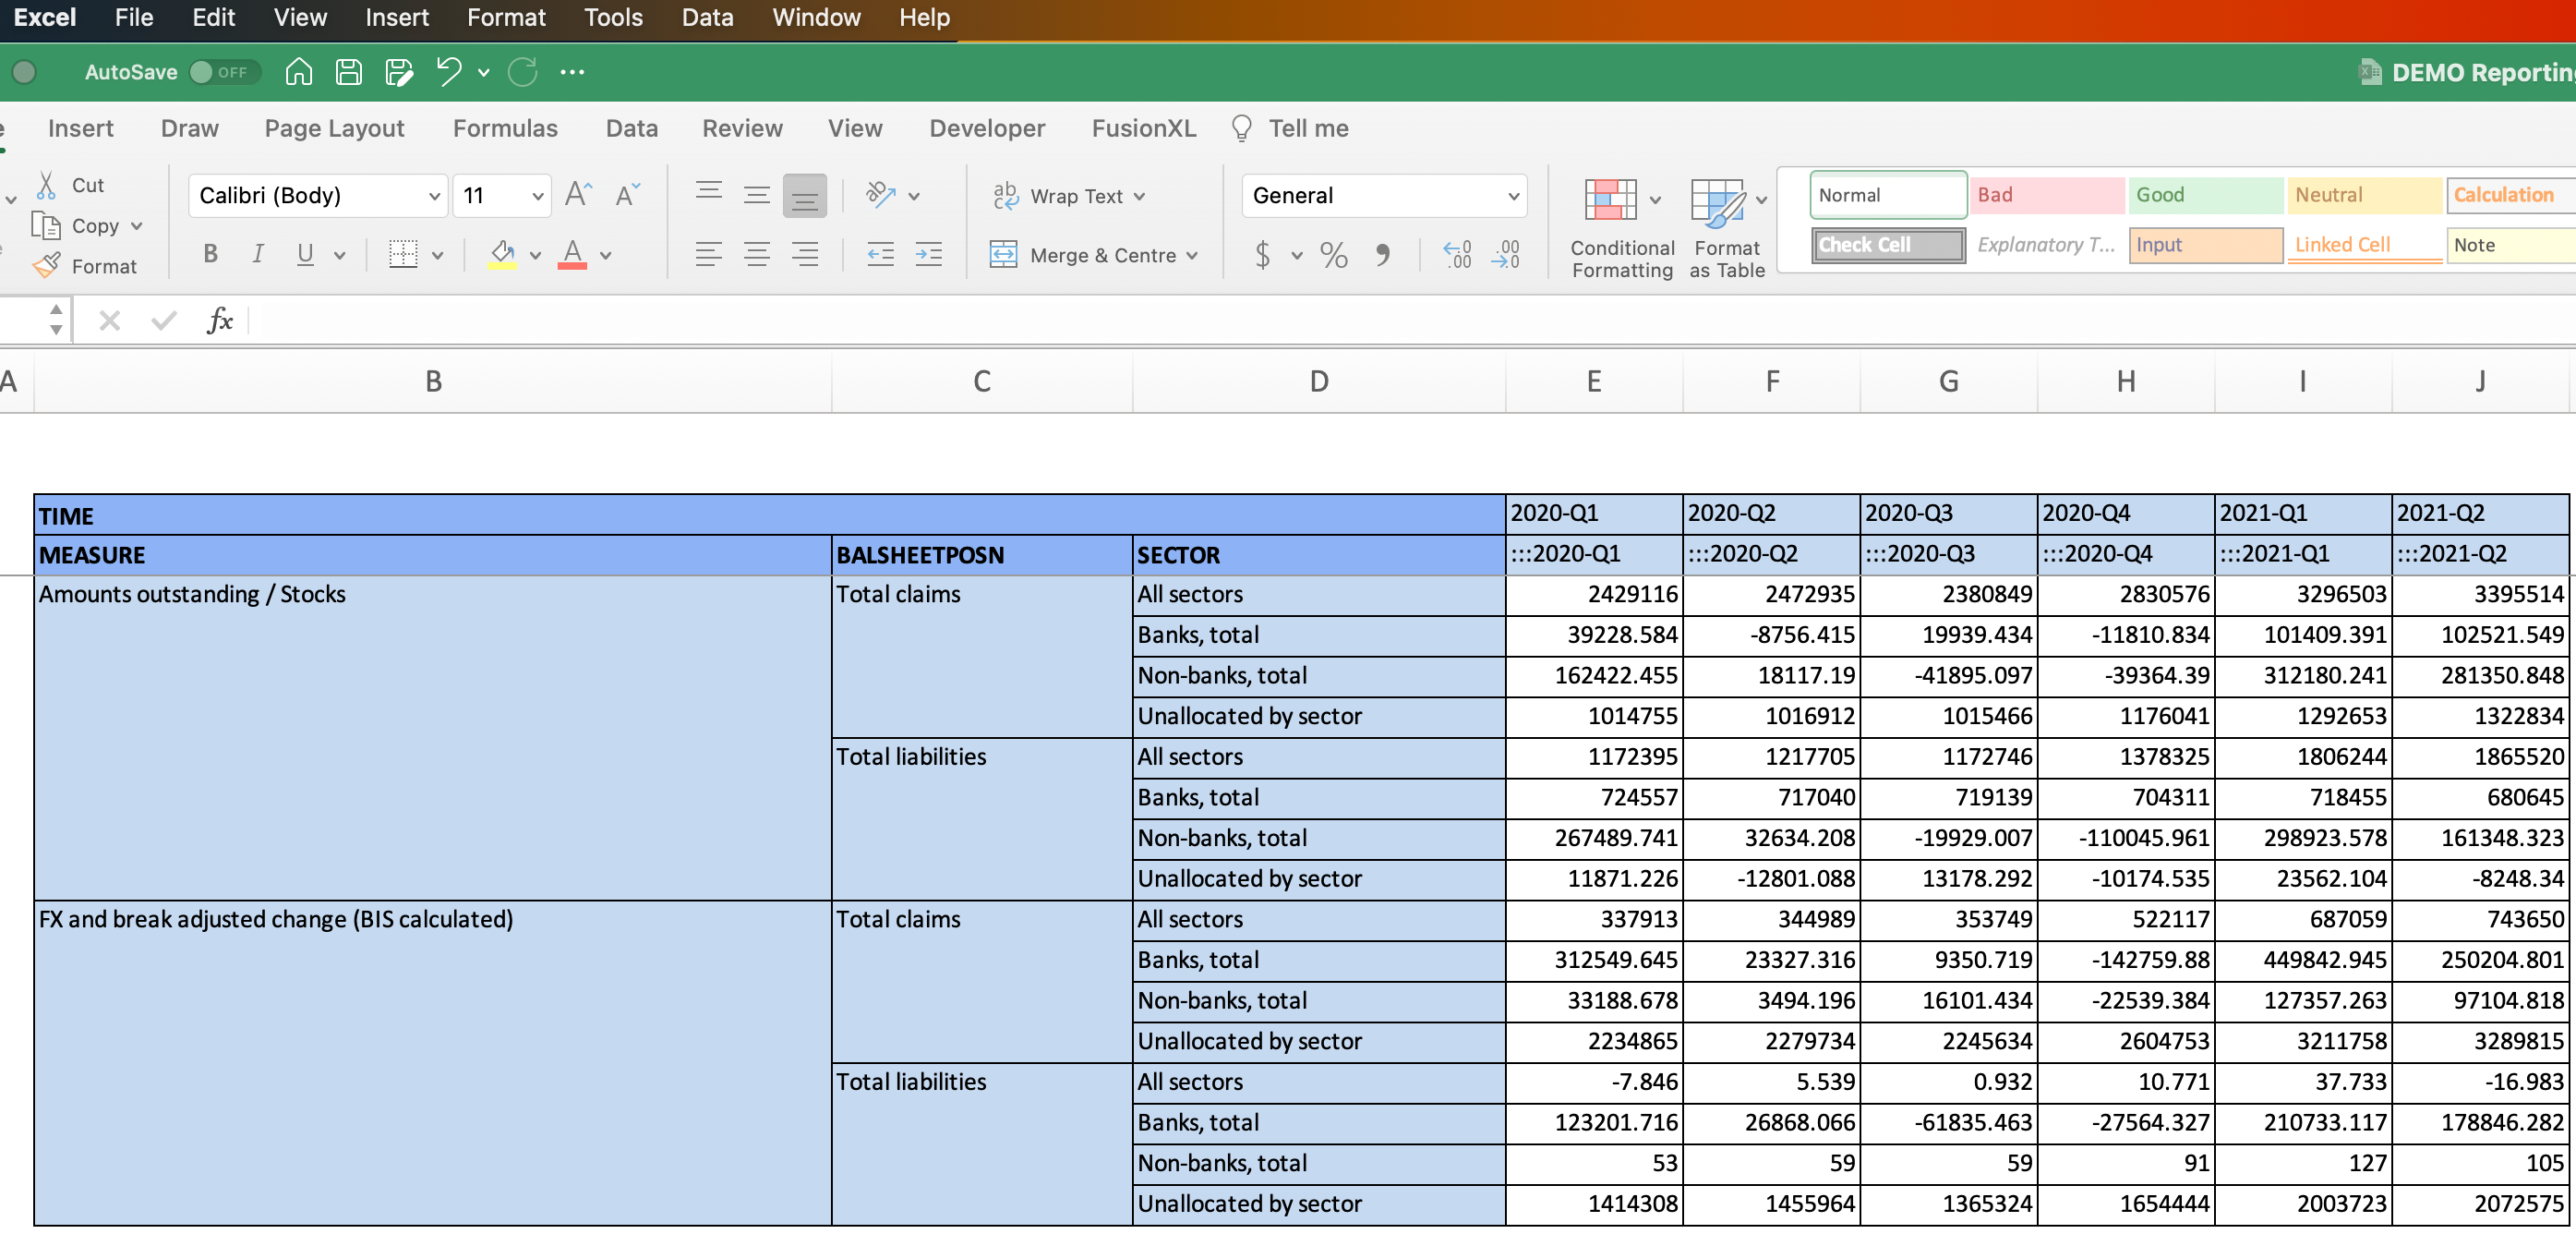
Now that our data model is in place, we can use it to create our XLSX data collection template. It is important to note a few characteristics of the reporting template:
- No VBA, they are 100% Excel, no plugins required.
- The metadata required to read the workbook is embedded within the workbook.
- The worksheet is protected to prevent tampering.
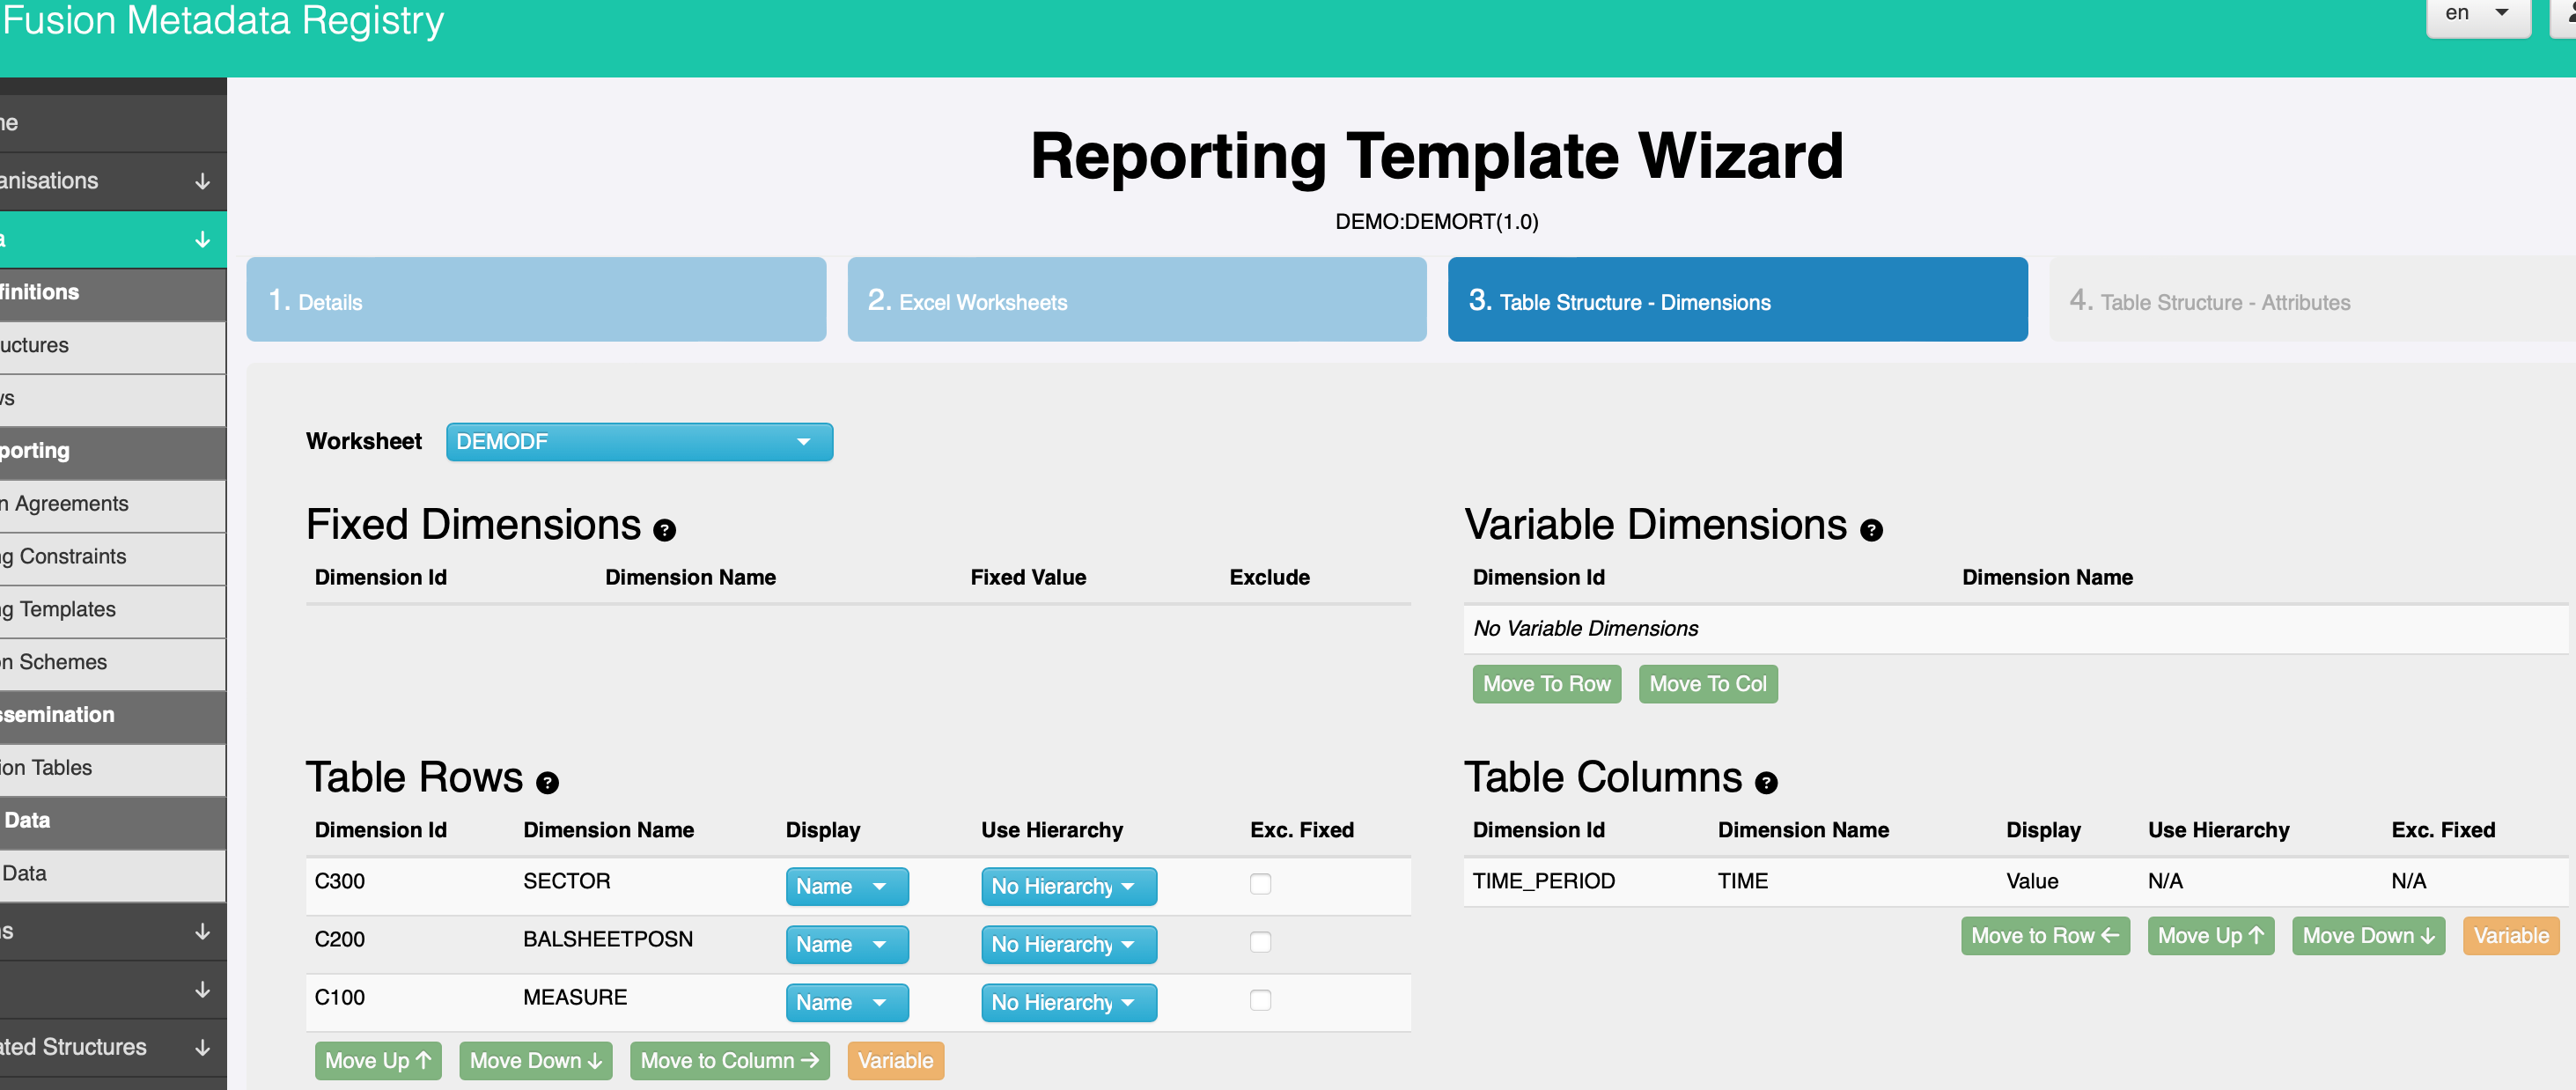
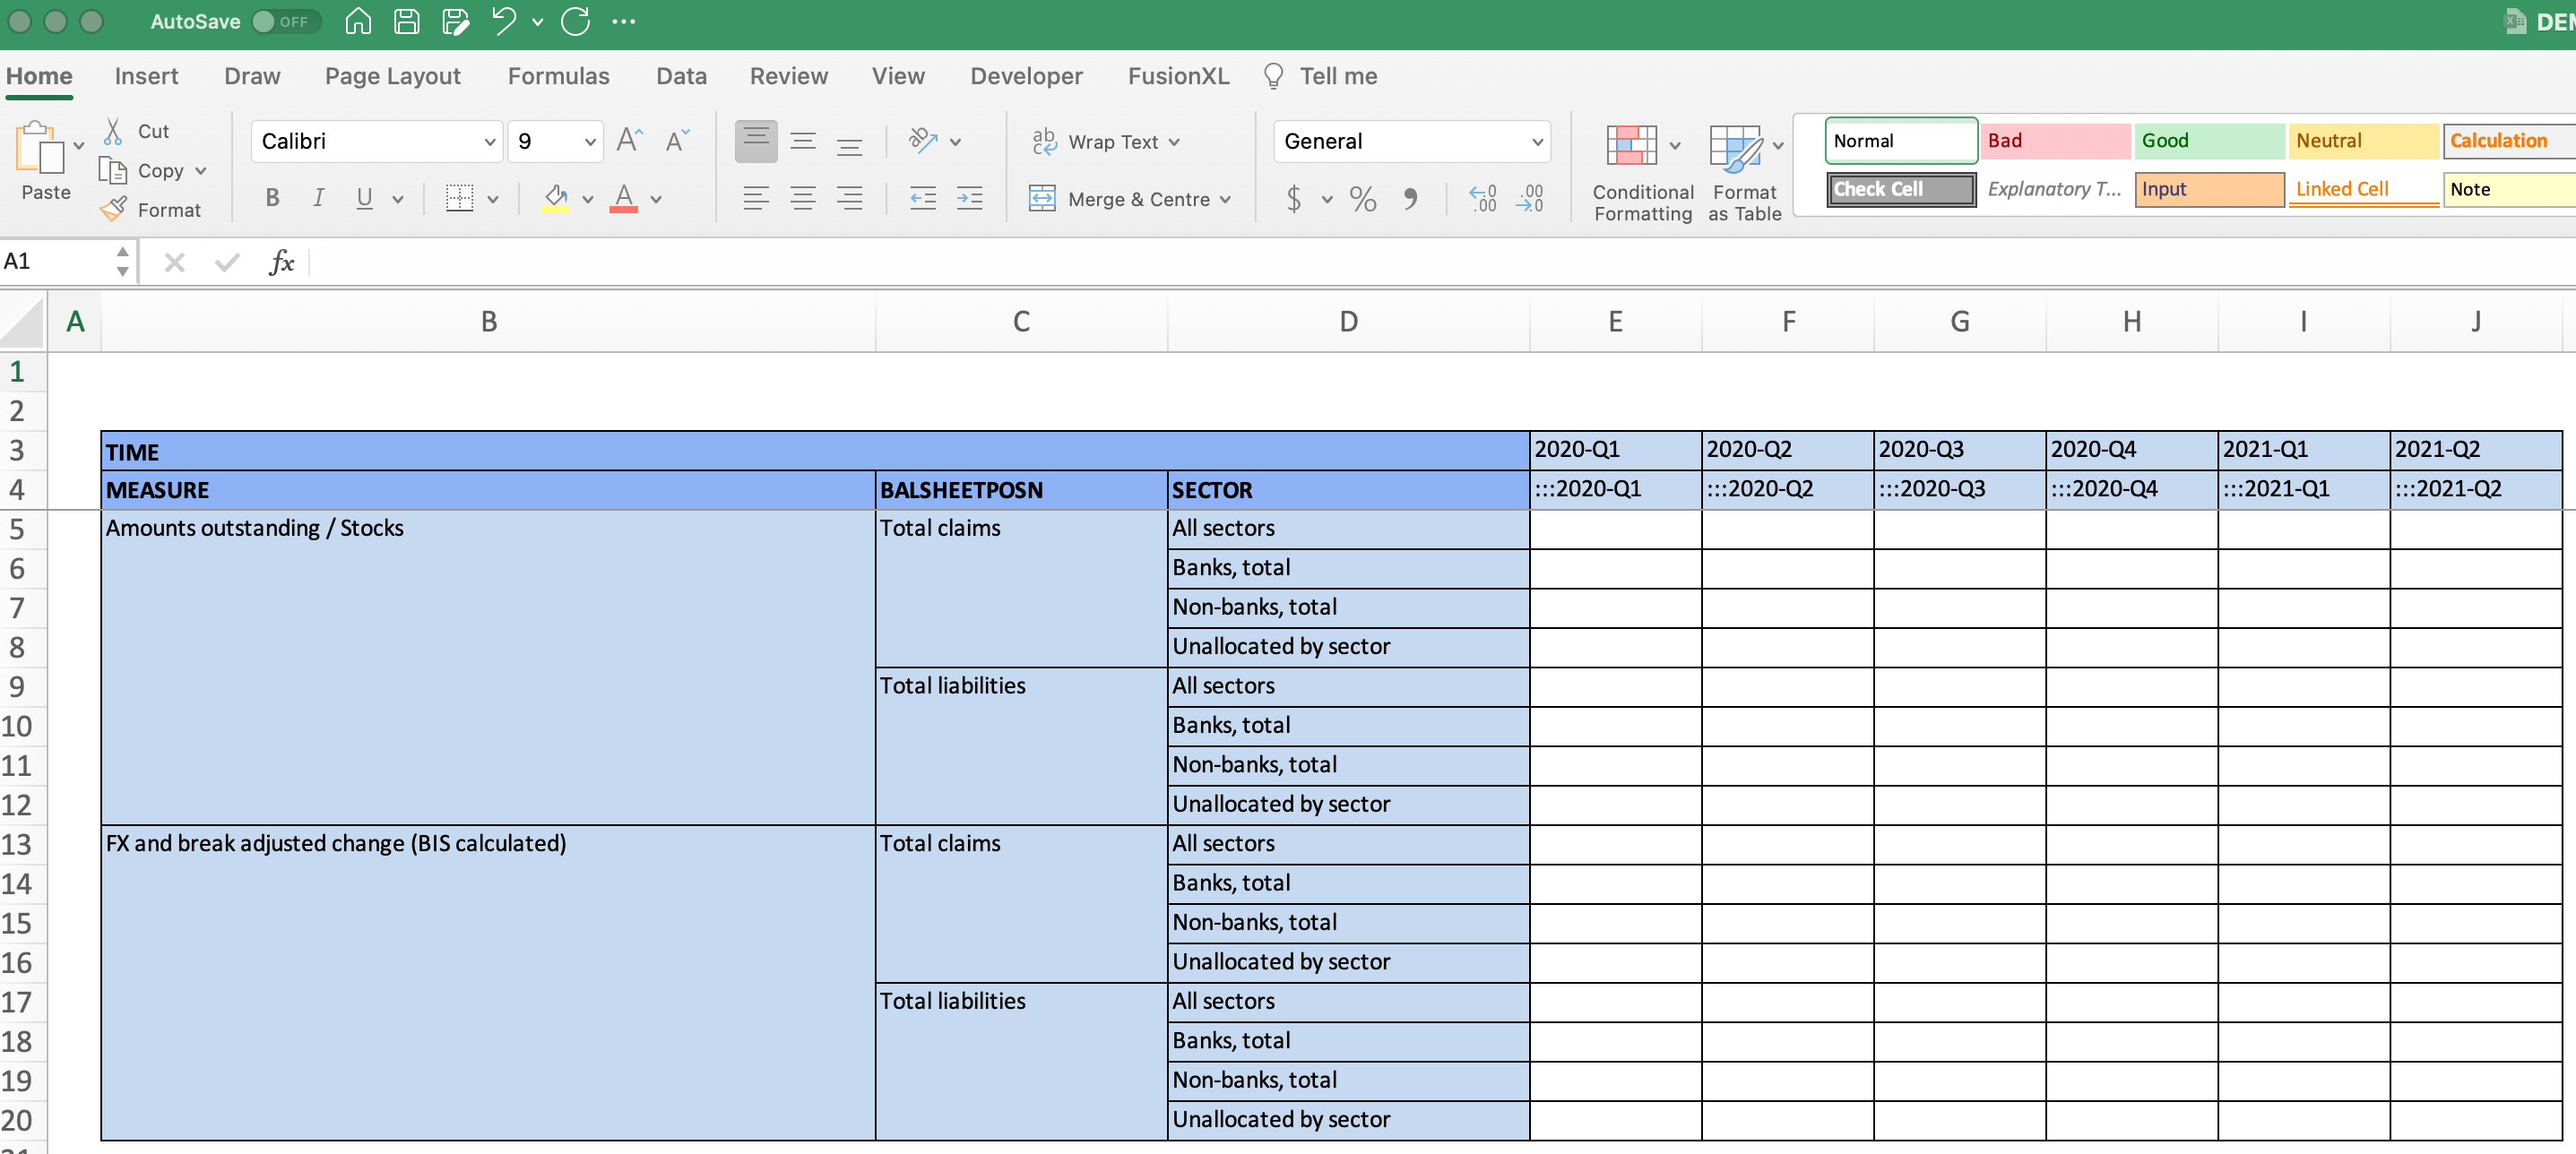
Even though the data model is exactly the same as the published table, we will present the model differently for the reporting template which will be sent to the target data respondent (Germany) and completed with data. The outcome from this exercise is the creation of the following excel template. As you can see in the template, the time periods run across as columns which is not the way the data was published in the data portal.
TIP Reporting templates created using FMR can be sent to respondents who are using older versions of MS Excel, using Google Sheets, or using OpenOffice or other tools. The methods used in these templates are compatible with many tools that are capable of reading and writing XLSX files.
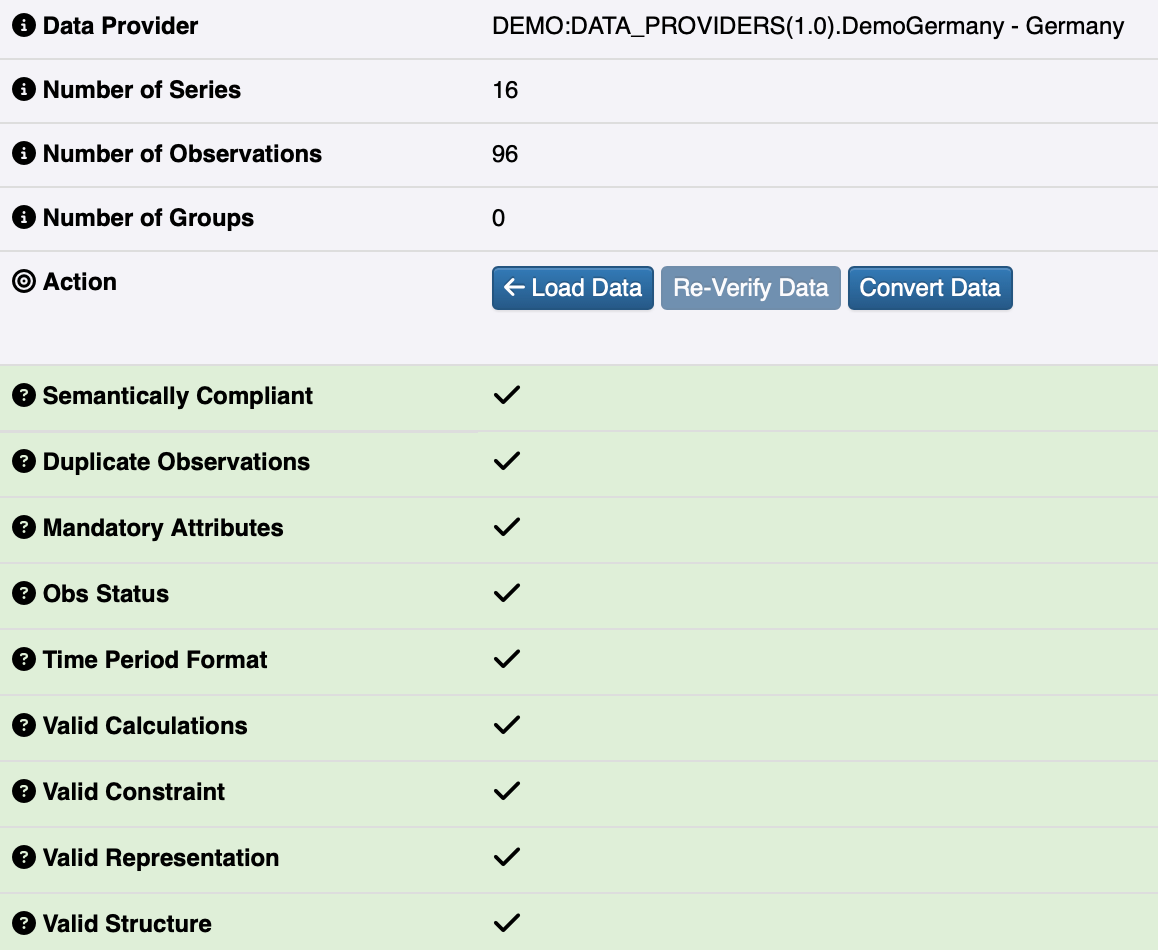
Validating Excel data received
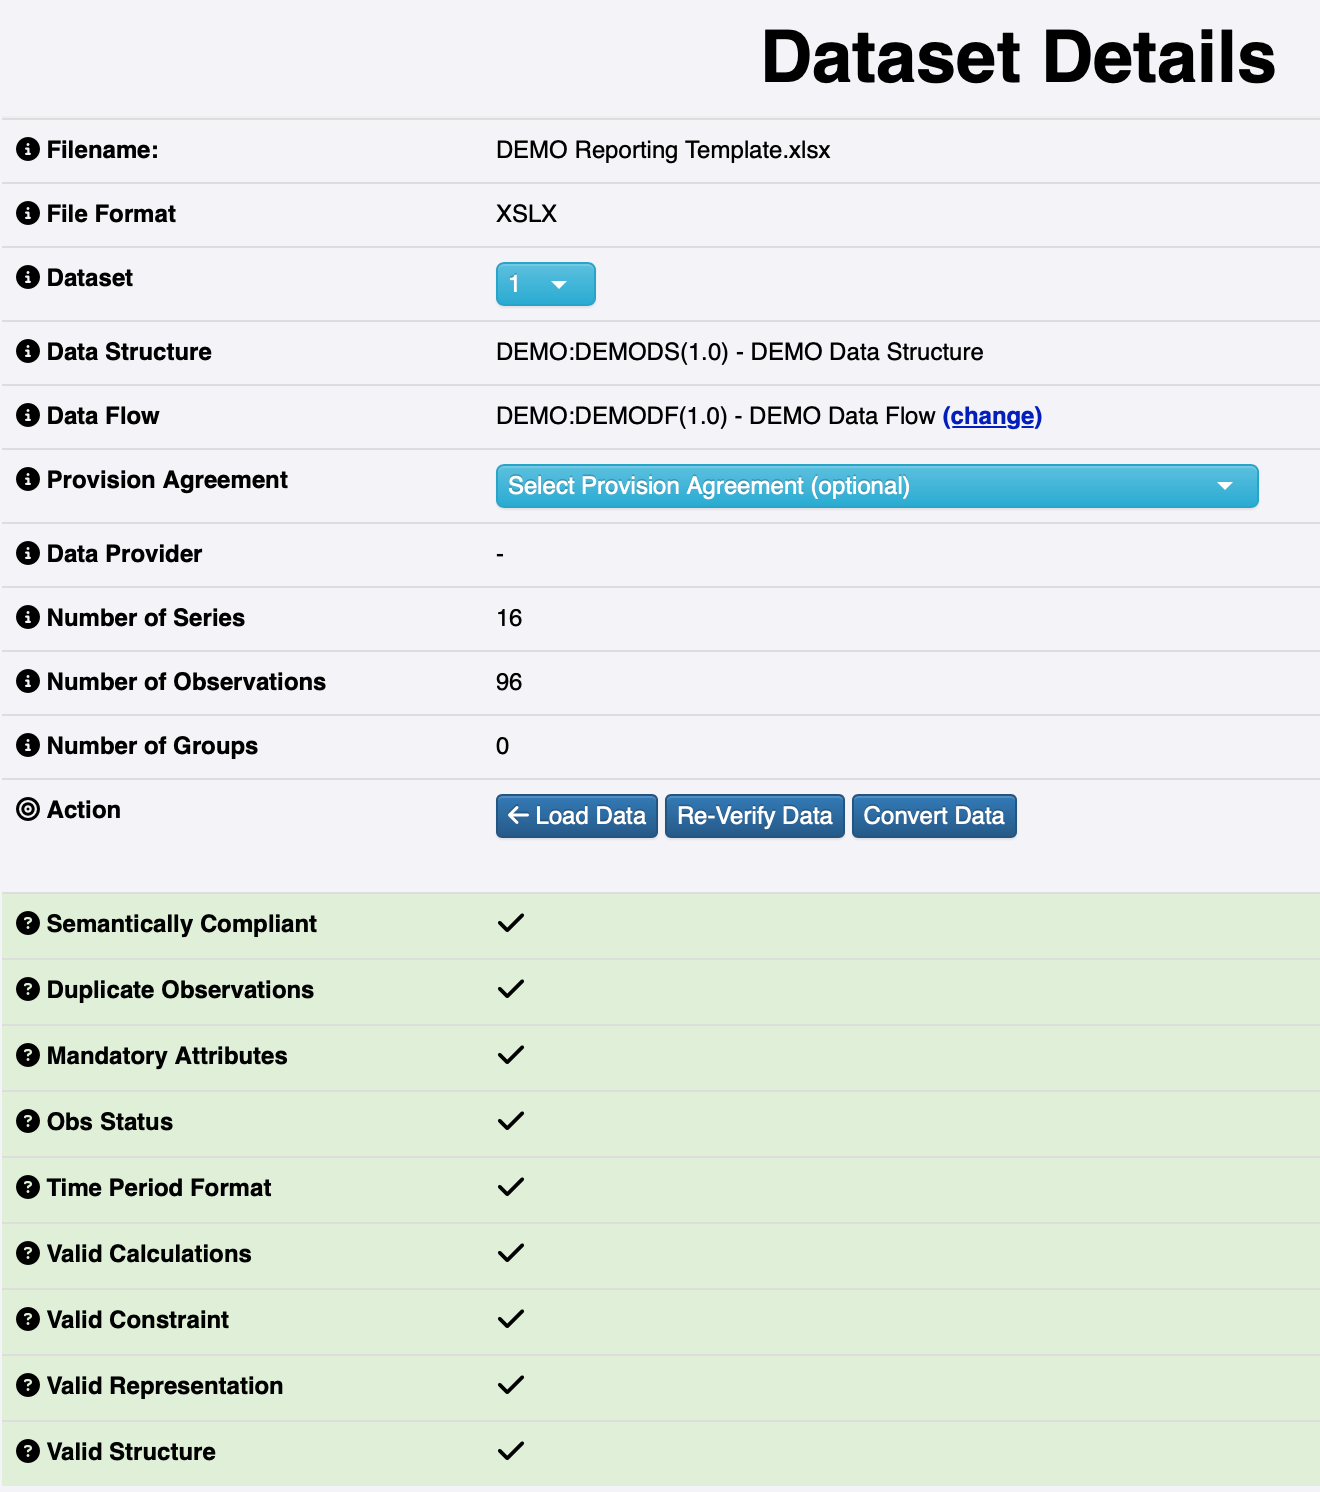
Once completed, the template is returned and validated:
The data model is a great asset during this validation process, it enables us to perform a number of quality checks:
Converting the data to SDMX
Now that we have received and validated the data in the XLSX reporting template, we are ready to start preparing to publish them online. The open source software .Stat Suite provides the data portal functionality that we want.
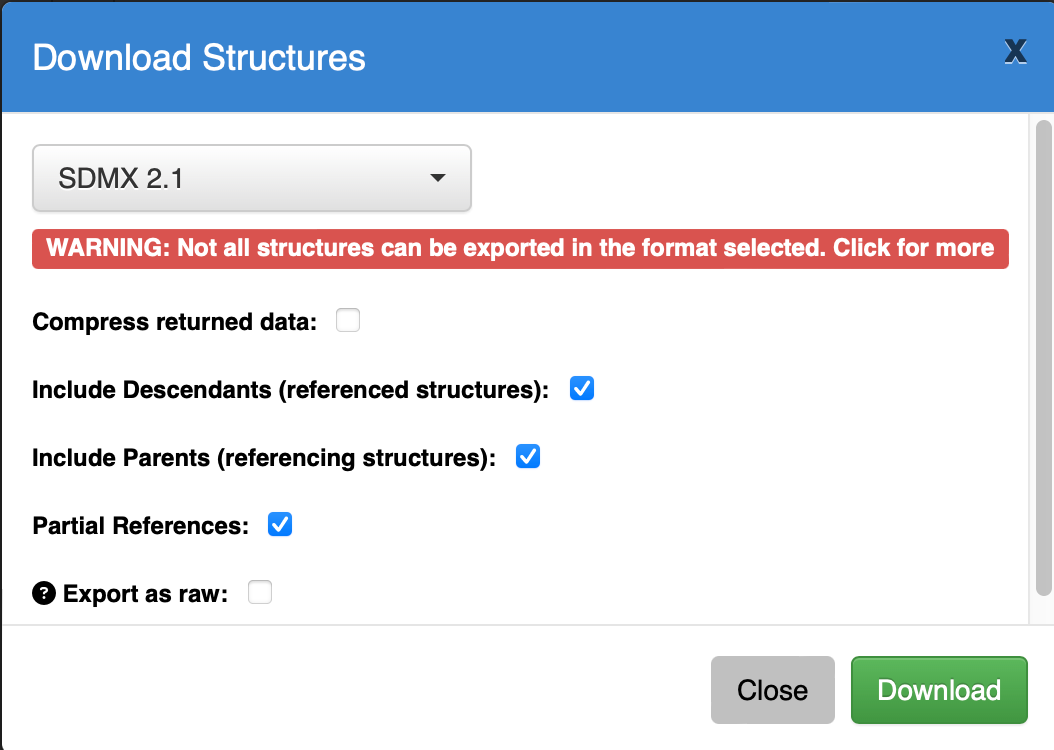
It is very straightforward to prepare the data model and data for import into .Stat Suite. First, we do a bulk export of the data model from FMR. Secondly, we transform the complete and validated XLSX file to a format that is supported by .Stat Suite.
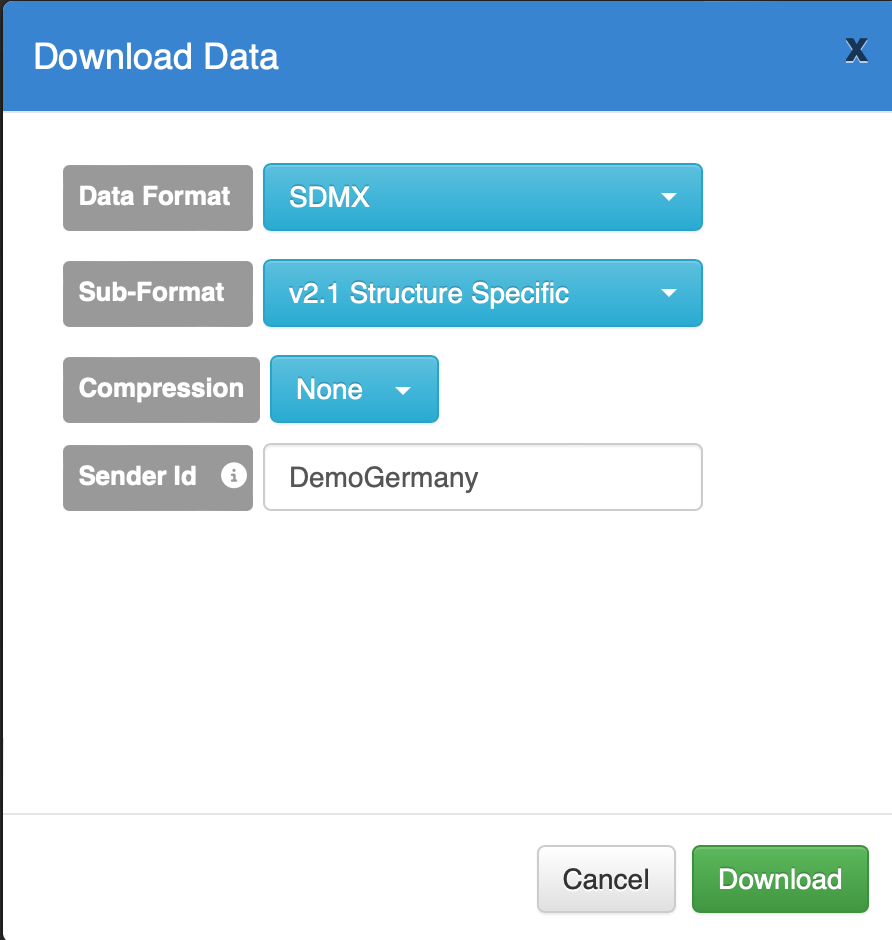
We have to perform a few mechanical steps in order to prepare the input files for .Stat Suite:
- FMR “Bulk download” window to export the data model for upload into .Stat Suite.
- FMR “Convert Data” window to upload the XLSX file in preparation for conversion into a format compatable with .Stat Suite.
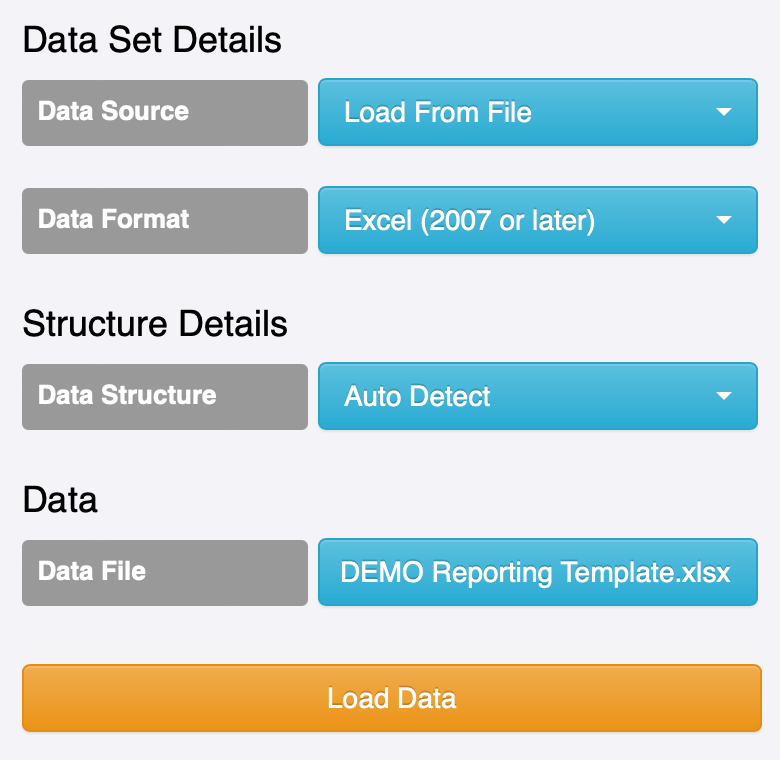
- FMR “Convert Data” window to remove the provision agreement in order to be compatible with .Stat Suite.
- FMR “Convert Data” window to transform and download the XLSX file in a format compatible with .Stat Suite.
With our data model and the validated data converted and exported into a standard format, we are ready to publish these data online for public access.
Installing .Stats Suite
First, we need to install .Stat Suite. For this example we will use the Docker Desktop installation method. Installation of .Stat Suite via Docker Desktop is explained in the following video and article:
How to install .Stat Suite using docker compose in less than 10 minutes (https://www.youtube.com/embed/9D4Q9K33JJg )
https://sis-cc.gitlab.io/dotstatsuite-documentation/install-docker/docker-compose/
https://gitlab.com/sis-cc/.stat-suite/dotstatsuite-docker-compose
TIP: If you run into problems downloading .stat suite using the “Clone with ssh” link demonstrated in the video, try the “Clone with HTTPS” link instead.
TIP: Installing and getting .Stat up and running using docker is not trivial. Some of the tasks will likely require the assistance of a member of your IT team to install additional software on your computer, such as GIT and Postman. Be patient and pay close attention to the details as you go through the How To video.
Uploading to .Stat Suite
Once .Stat Suite is installed and running, we want to upload both our data model and our data into .Stat Suite.
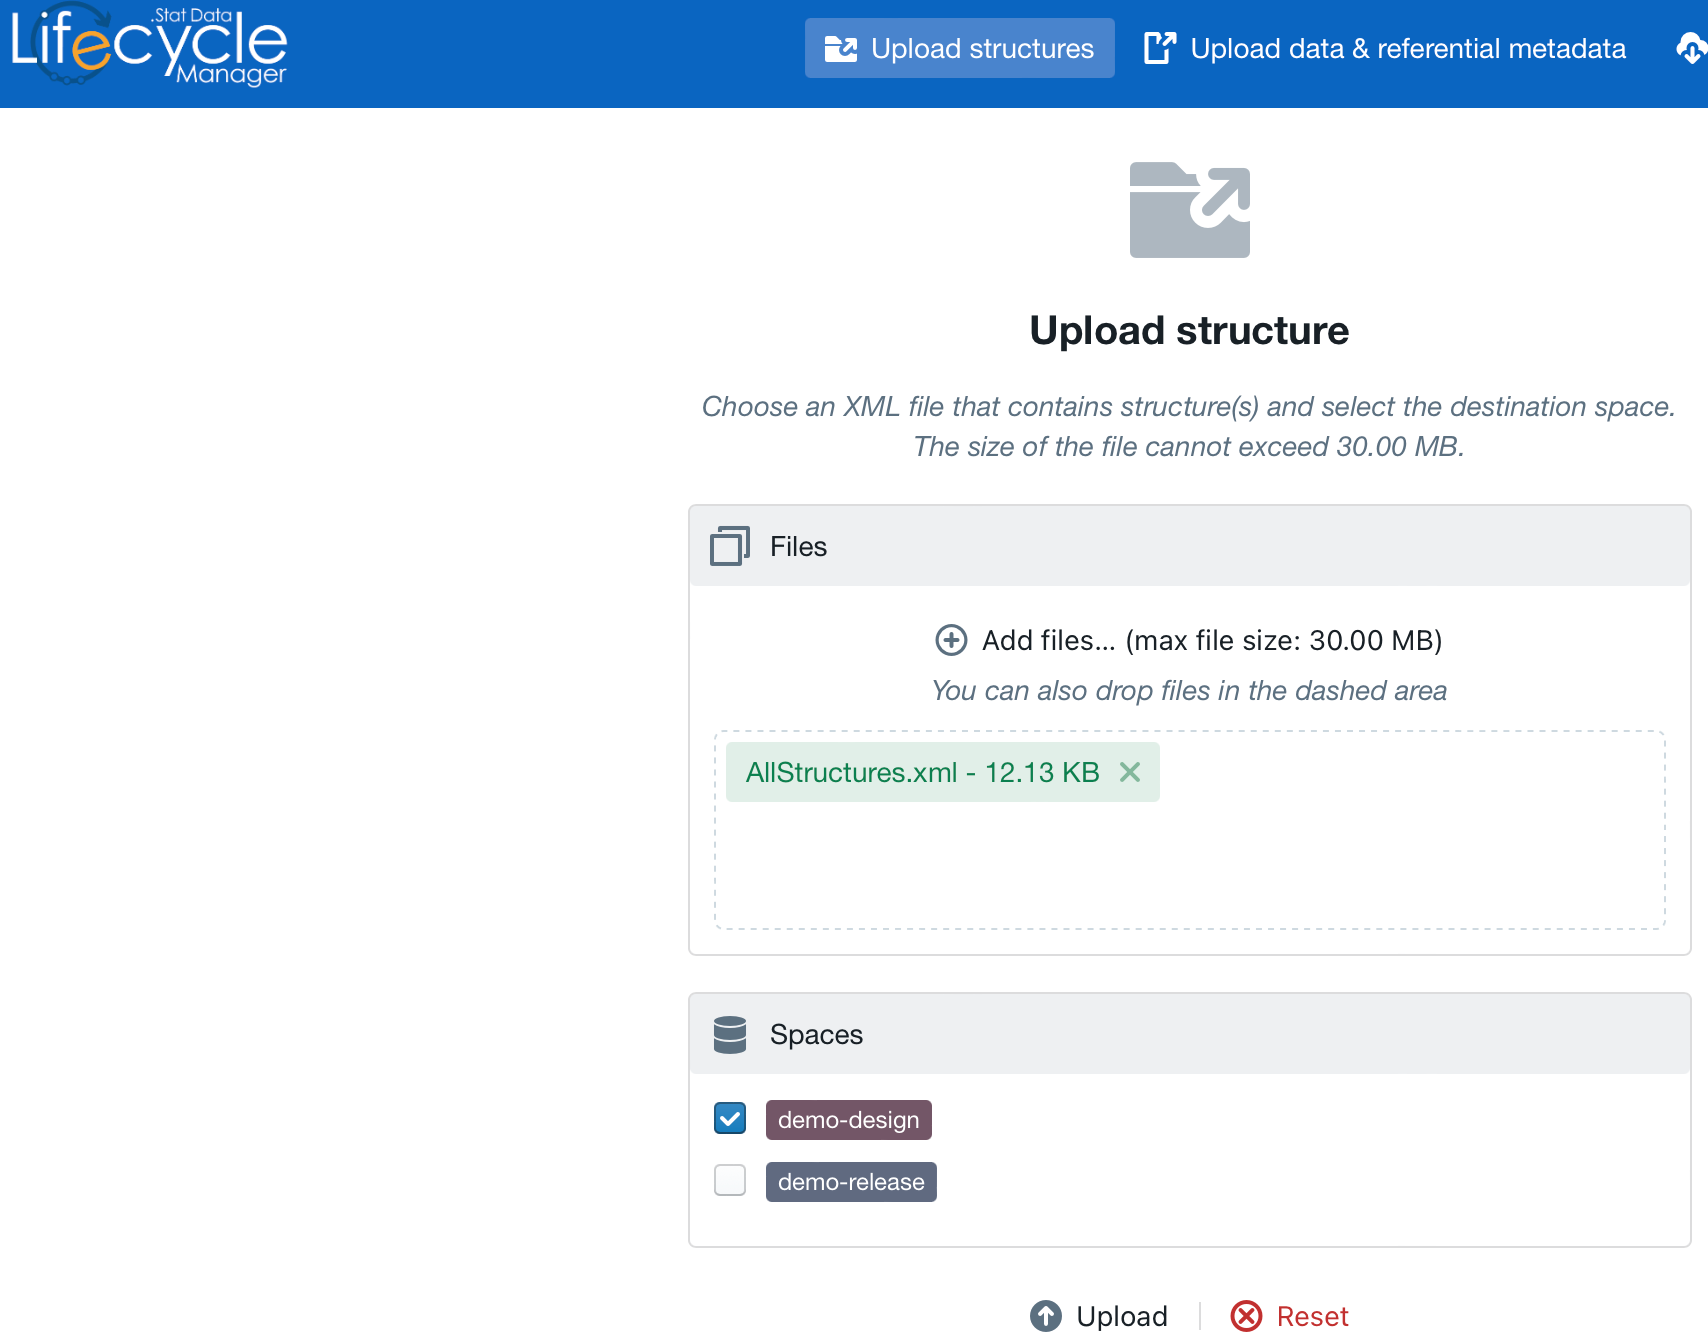
- Uploading the data model:
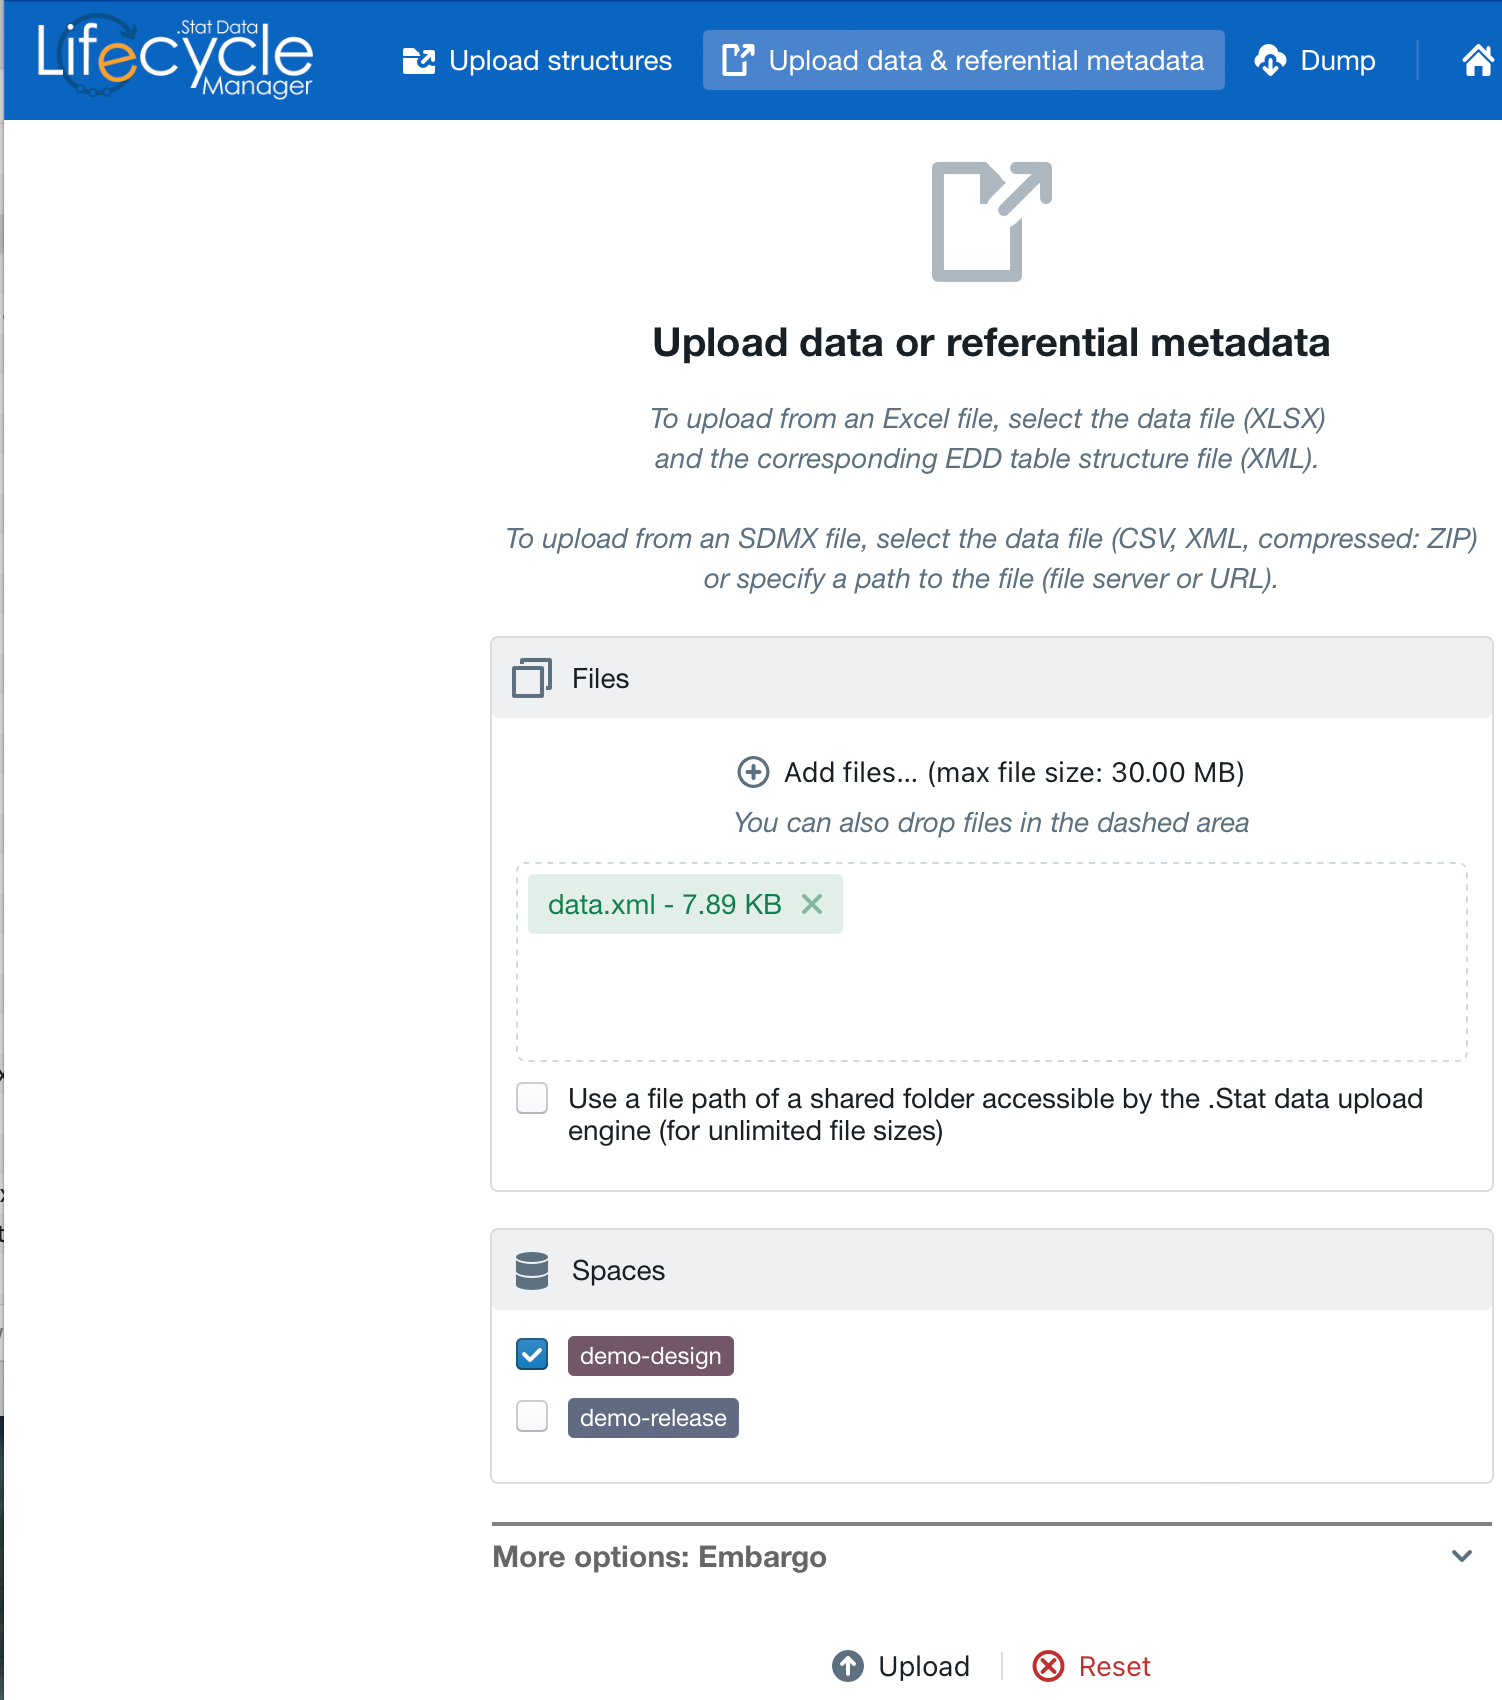
- Uploading the data
Now we confirm that the data (dataflow == data table) is now available in .Stat Suite.
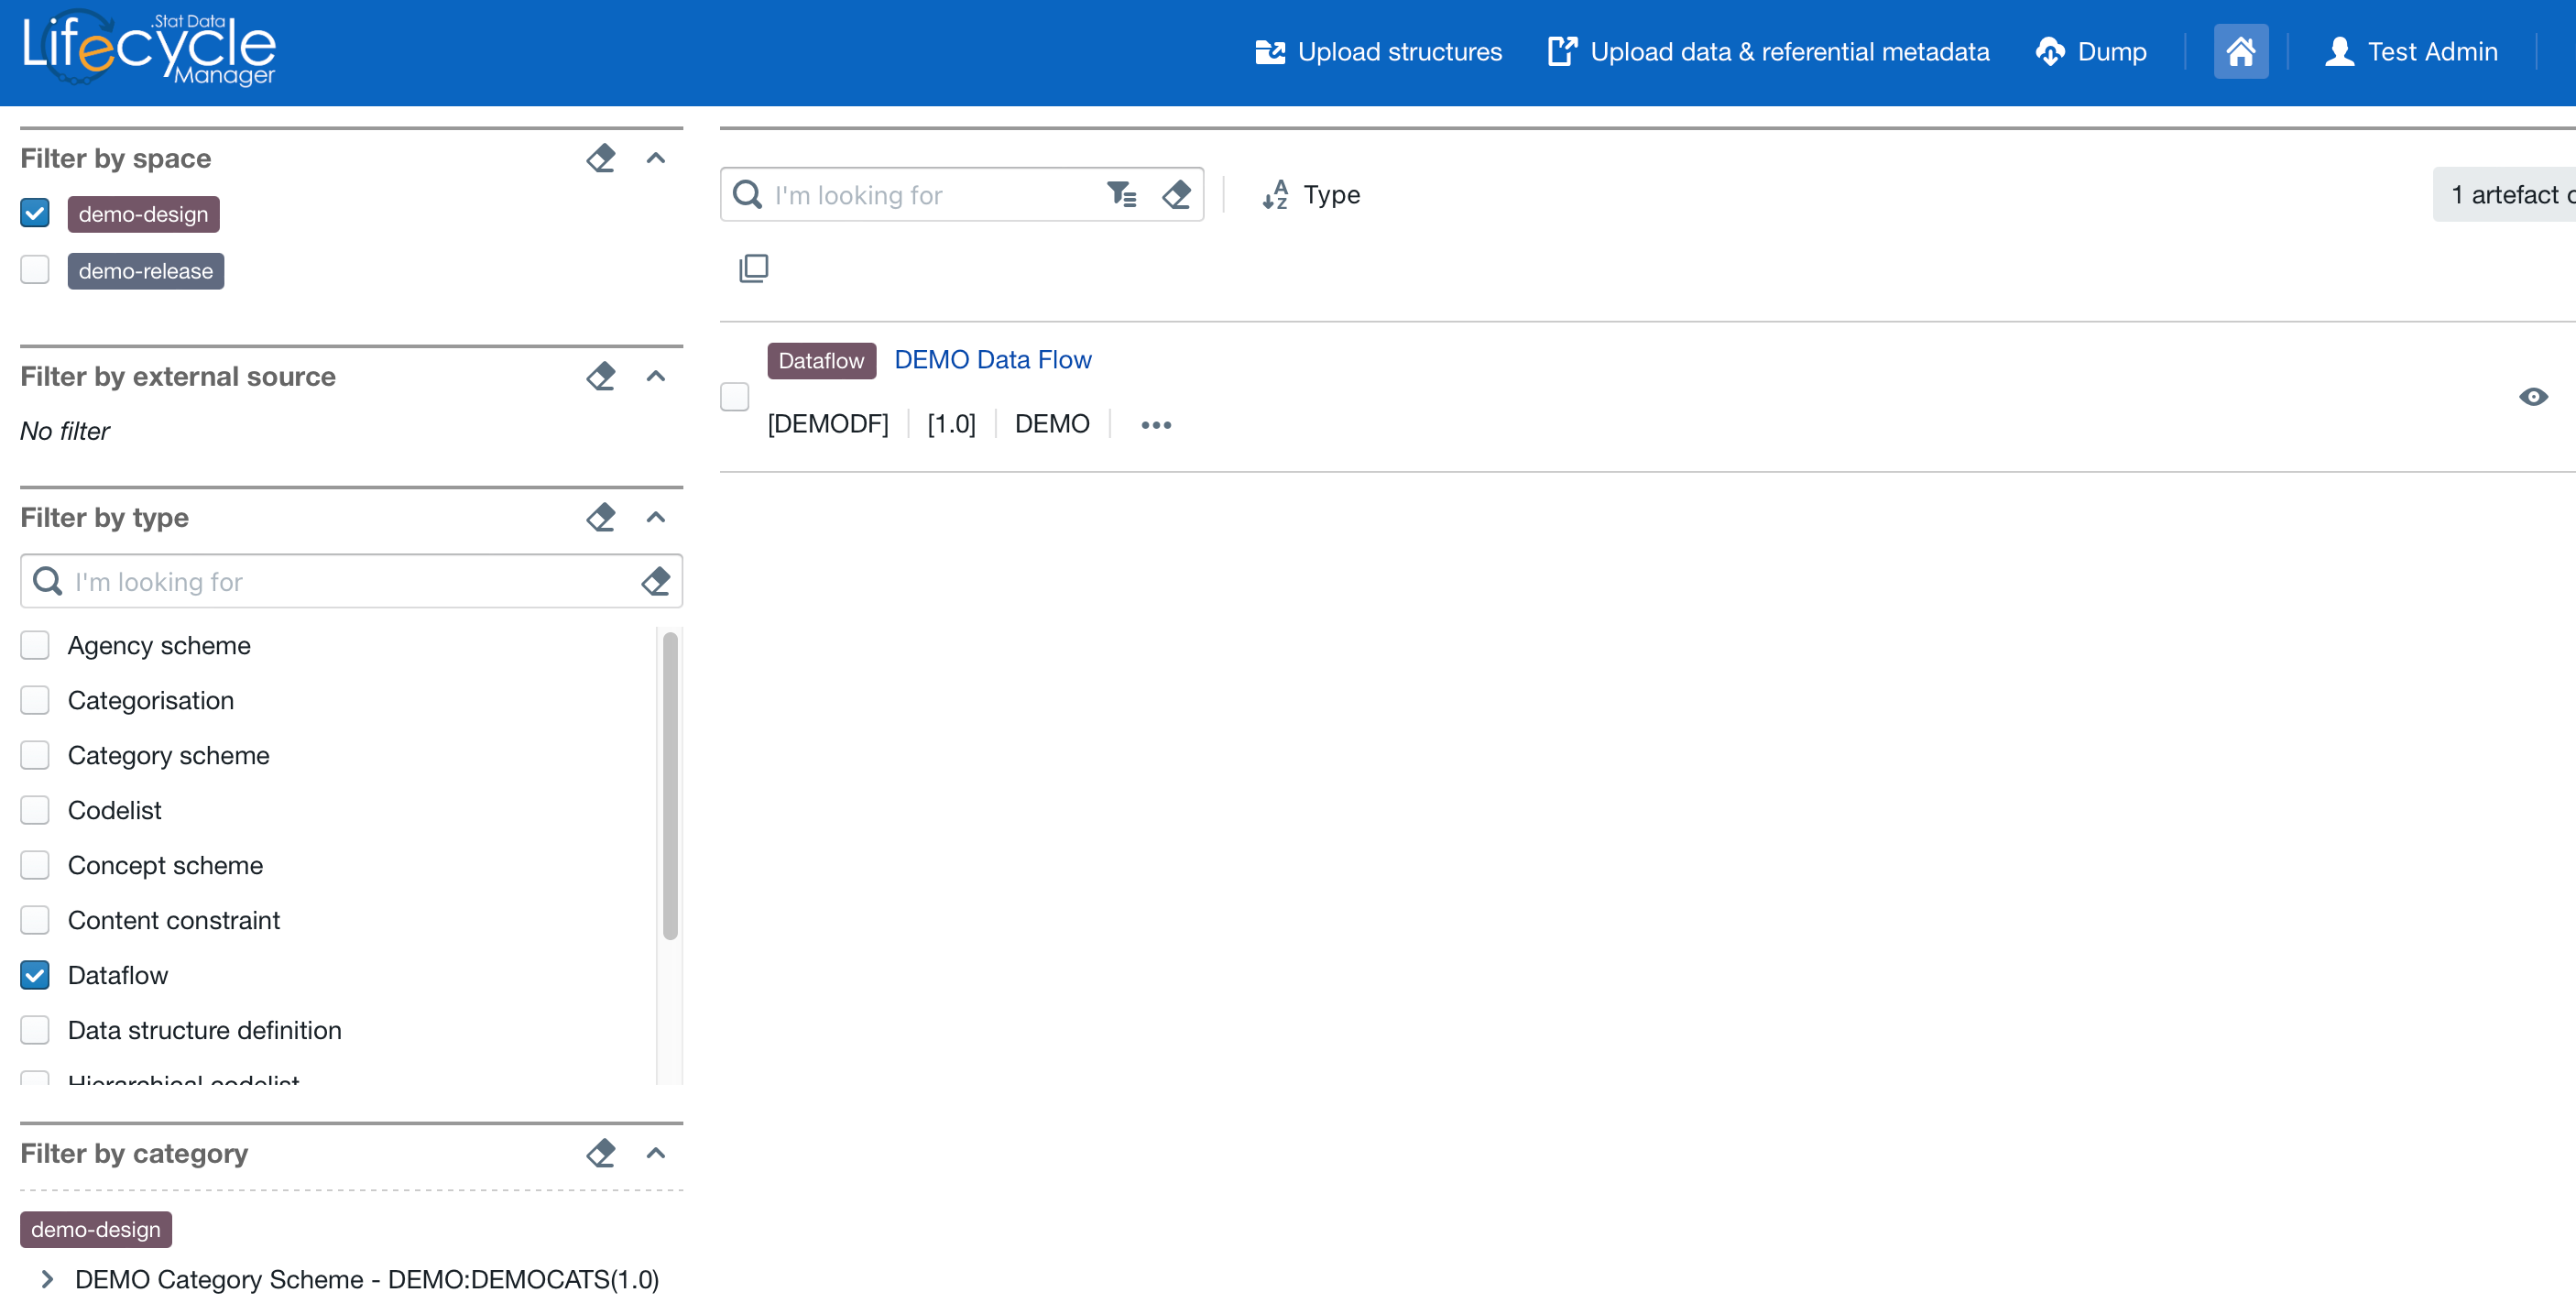
The default view may not be what we want but with a few minor customisations we arrive at the desired design of our table to be published.
Summary
This article did not explicitly detail how to perform every step in the process but neither did it hide any complexities. The process works as described. Modelling data, adapting the model to SDMX, and implementing SDMX-based tools to digitalise and improve data production processes is a realistic and achievable goal in teams and organisations of all sizes. Care should be taken to ensure that selected approach is fit for purpose and realistic based on resource constraints however, simple and complex solutions are both possible and it is not as difficult as it might appear at first glance.
The SDMX information model and technical standards are the fundamental enablers of these advancements in data production. The learning process to become competent using the tools and modelling data in accordance with the SDMX standard are being supported through articles and elearning courses and also via the SDMX Users Group .
Rest assured that more articles and elearning modules are forthcoming to assist with the learning, adoption, and use of SDMX to simplify your data production efforts and to help address your data and metadata challenges.
References
BIS Data Portal: Data table https://stats.bis.org/#ppq=LBS_REP_BANKS_IN_DE_XB_C_L;pv=2,9~1,12~0,0,0~name
Docker Desktop Installation: https://www.docker.com/get-started/
Fusion Metadata Registry (FMR) Installation: https://fmrwiki.sdmxcloud.org/Quick_start_guide_-_Deploy_as_a_Docker_Container
Fusion Metadata Registry (FMR) Changing Ports: https://hub.docker.com/r/sdmxio/fmr-mysql
FMR Excel Reporting Template reference: https://fmrwiki.sdmxcloud.org/Excel_Reporting_Template
How to install .Stat Suite using docker compose in less than 10 minutes (https://www.youtube.com/embed/9D4Q9K33JJg )
.Stat Suite Installation using Docker-Compose: https://sis-cc.gitlab.io/dotstatsuite-documentation/install-docker/docker-compose/
.Stat Suite Docker Compose Repository: https://gitlab.com/sis-cc/.stat-suite/dotstatsuite-docker-compose
Related article
BISStatistics Operations
Creating balance equality validation rules using hierarical codelists in FMR
Learn how Hierarchical Codelists can be used to define balance equality validation rules.
July 22, 2022
BISIT
How to use an external database with the FMR Docker image
Learn how to setup an external database for FMR's operational storage in preference to MySQL.
July 5, 2022