Dimensions vs Attributes and Time Series Breaks
This article is a continuation of the article “Simplifying Data Collection thru Dissemination using open source tools and SDMX” and extends the example to define dimensions vs attributes and demonstrate the concept of Time Series Break. The concepts are implemented in a data model and demonstrated using open source tools starting from a data collection template thru to dissemination in a data portal.
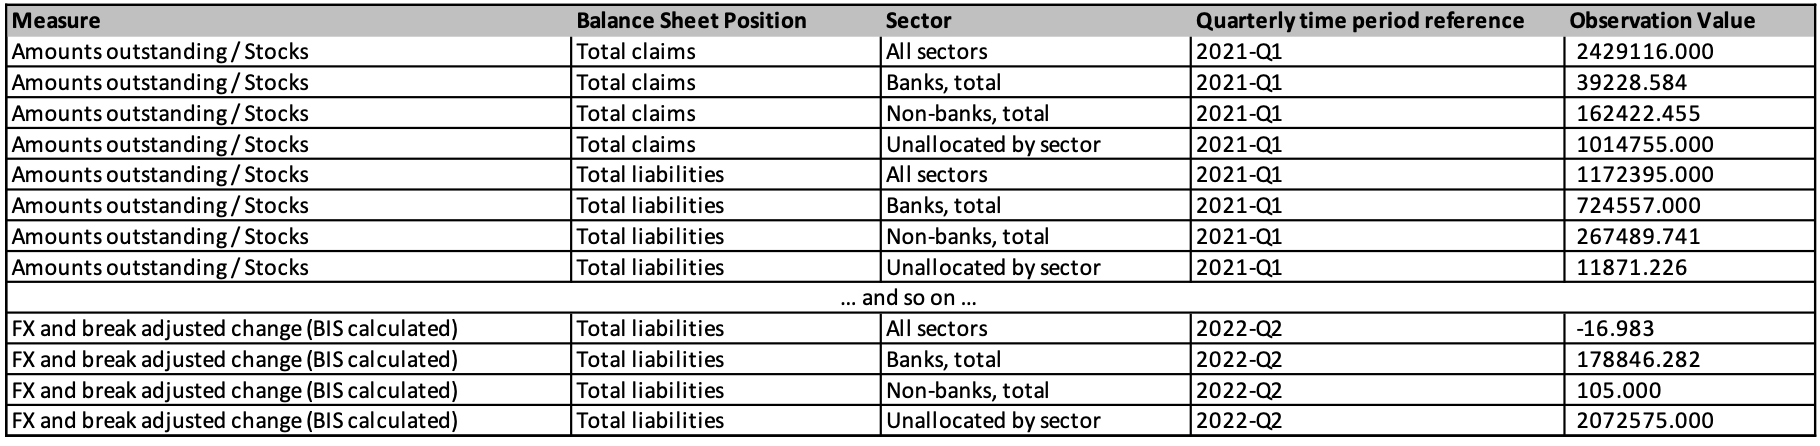
If you recall, in the previous article, we started with an online table:
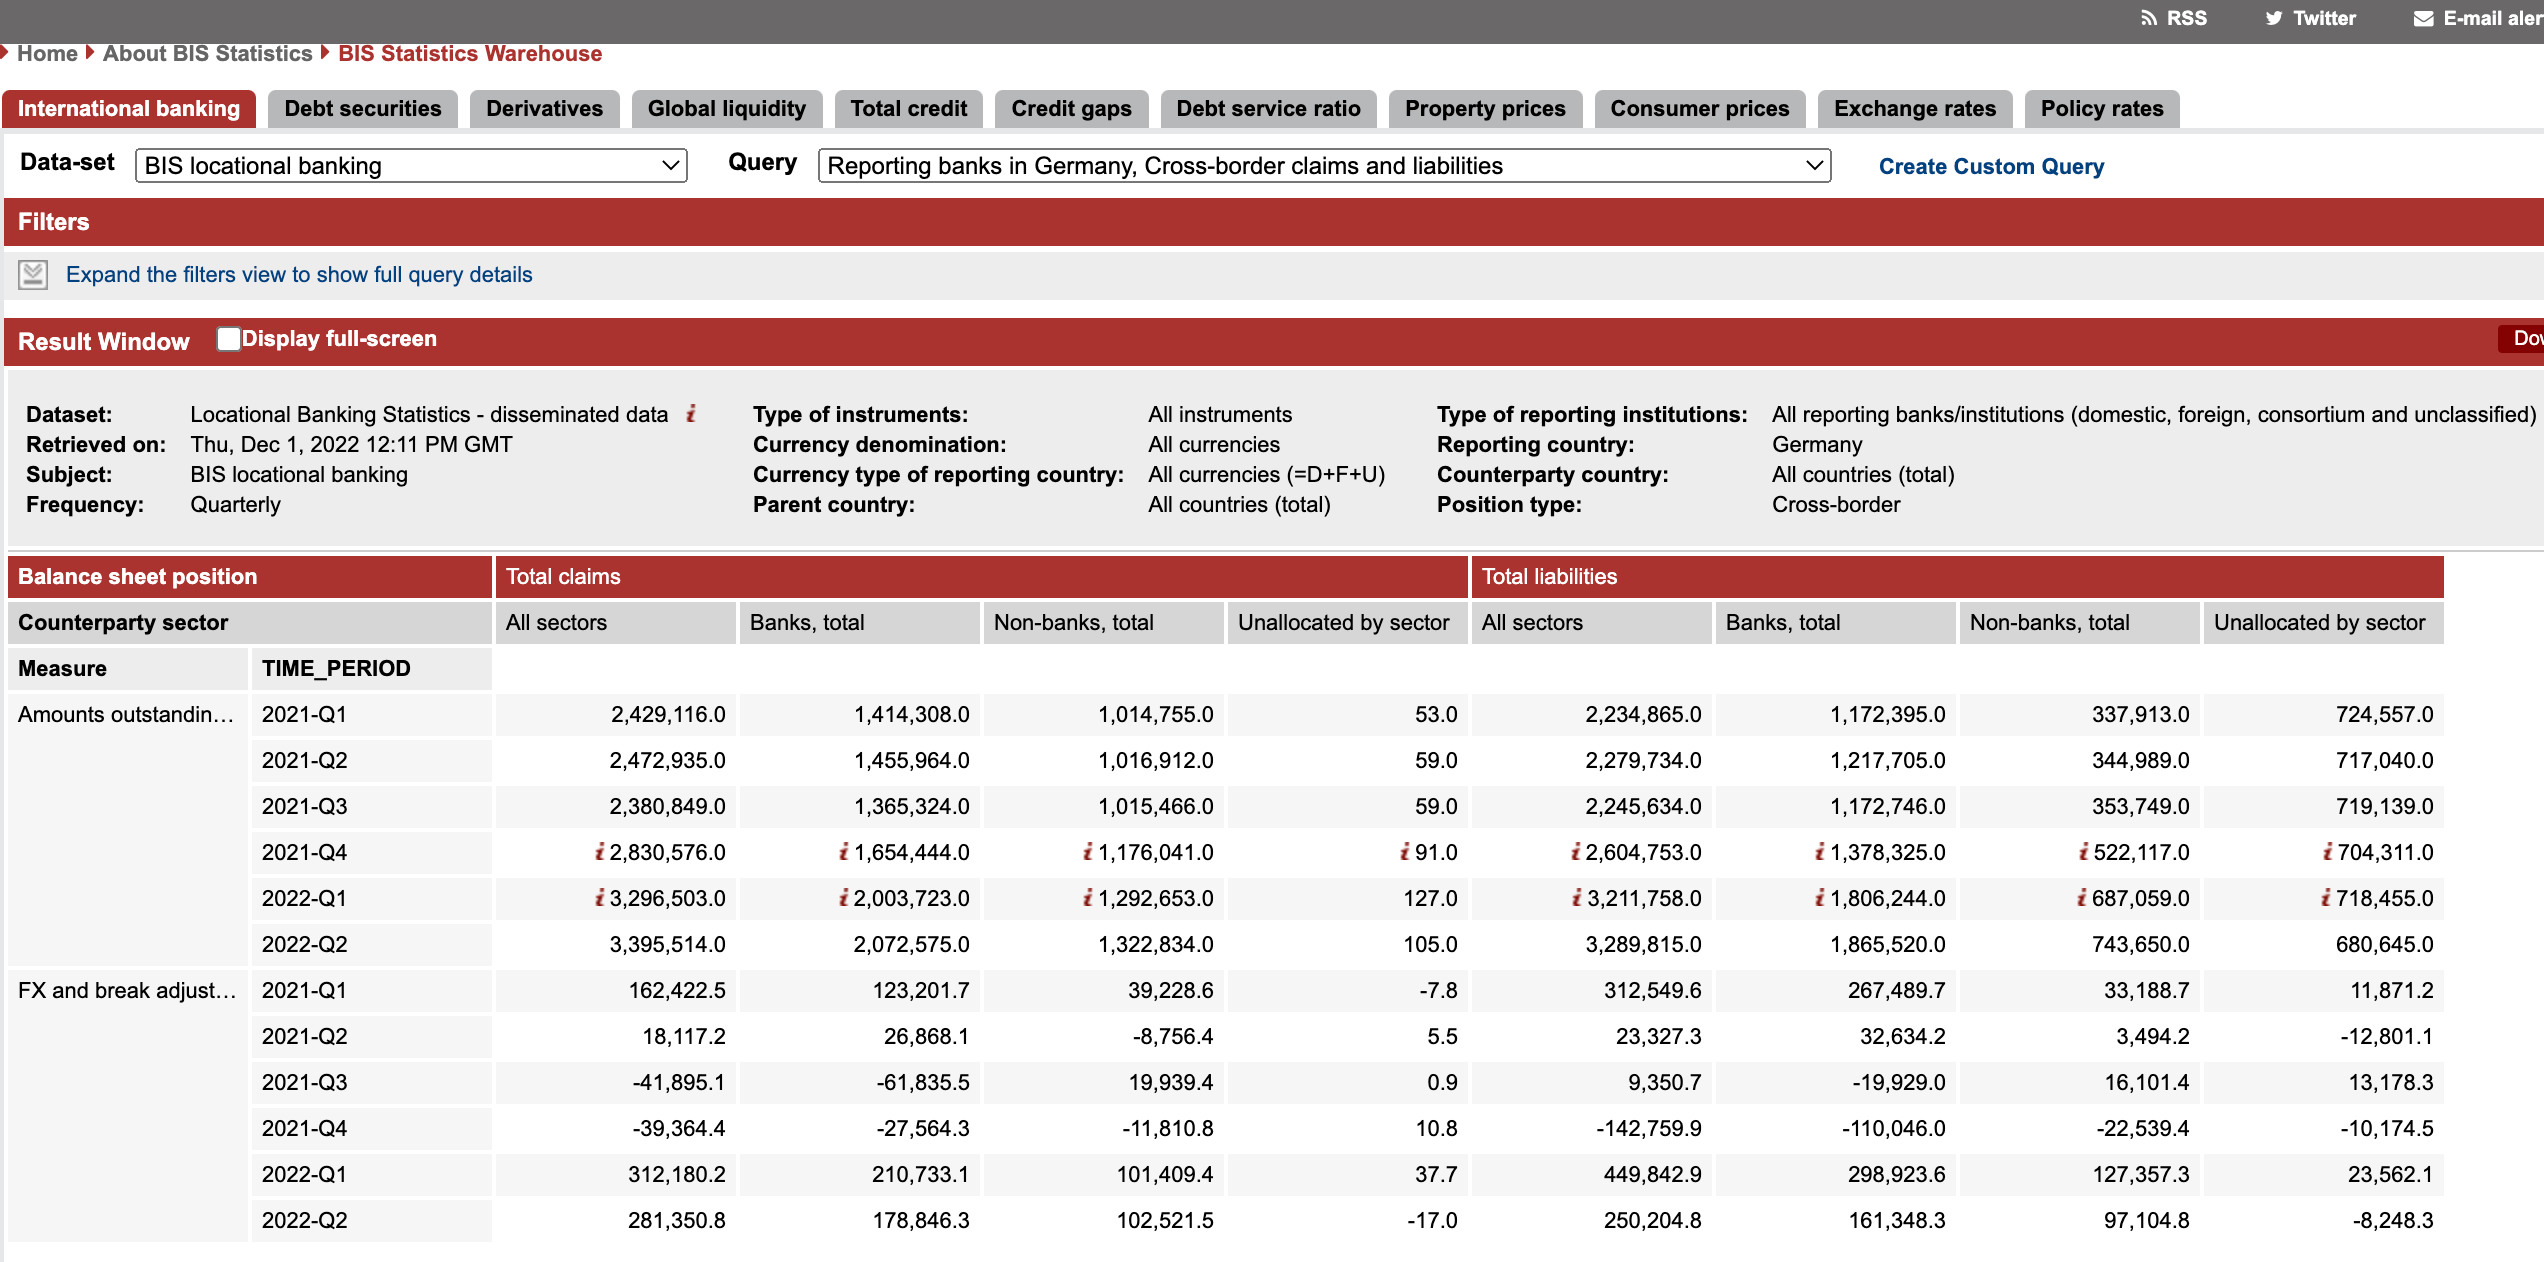
We then modelled the data and, by using FMR and .Stat Suite, we created an XLSX data collection template to gather data from a respondent, validated the response dataset, and then prepared and published the data table in a .Stat data portal using .Stat Suite as per the following image.
To enable the above activities and outputs, we installed Docker Desktop, the FMR docker image, the .STAT Suite Docker image and created instances of the two applications. All of this was made possible with the SDMX information model and technical standards.
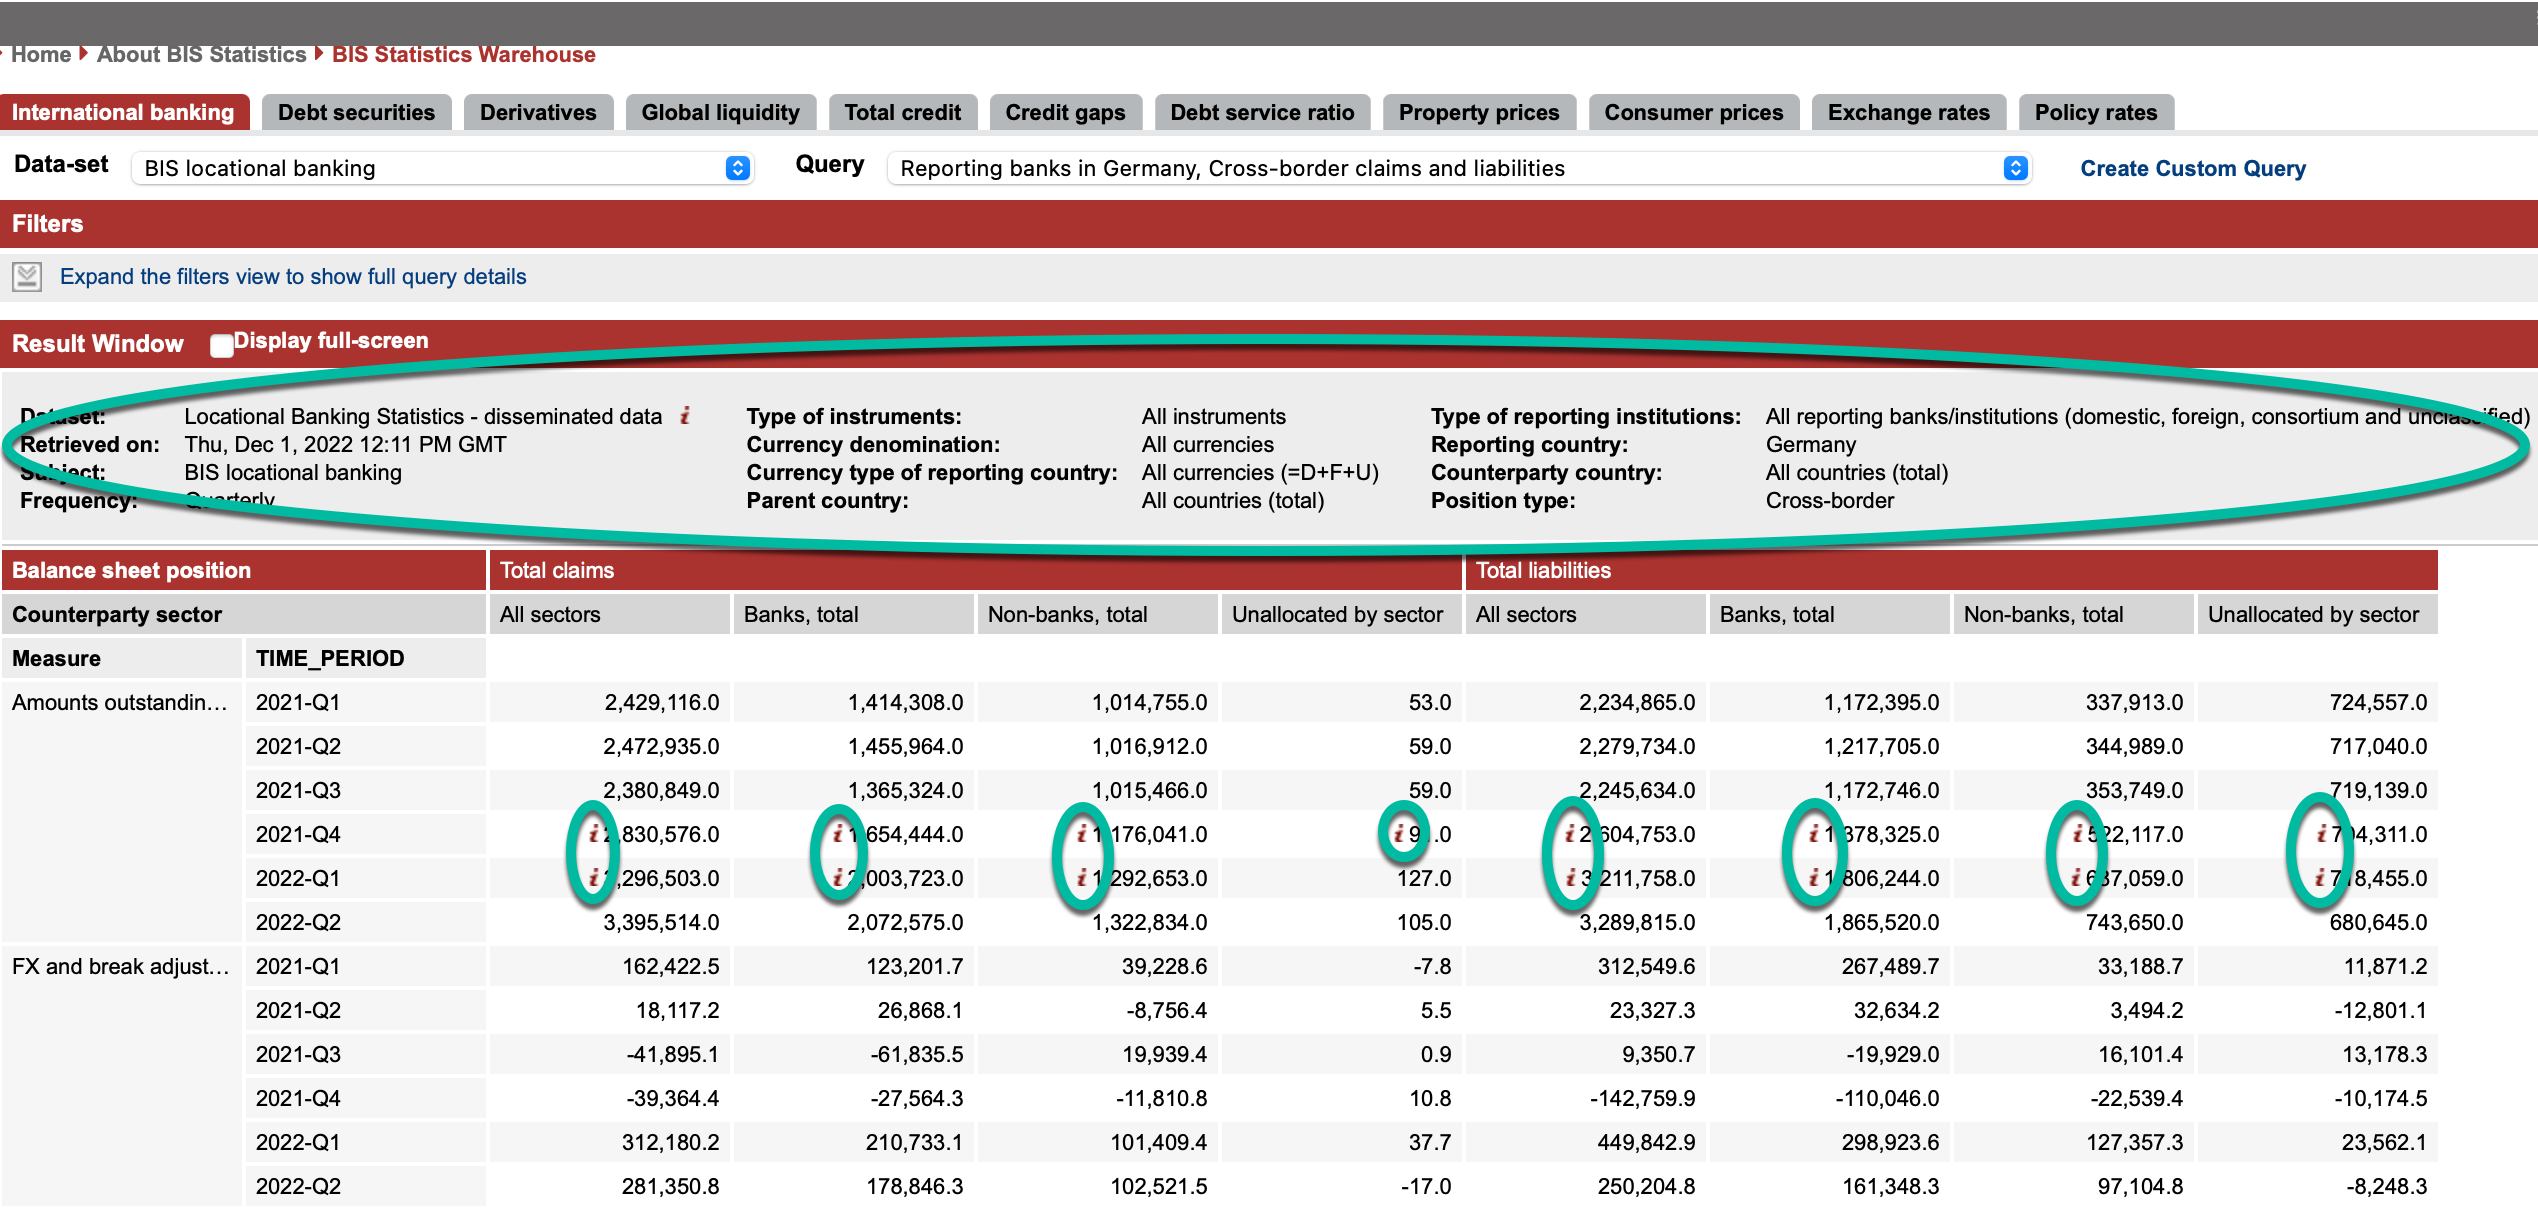
You may also recall that in the previous article, a number of items indicated by green circles in the following image, were intentionally excluded. We will now address those items in this article:
- observation level metadata, such as footnotes.
- table (dataflow) level metadata.
To integrate these metadata into our solution, we need to extend the data model that we previously created.
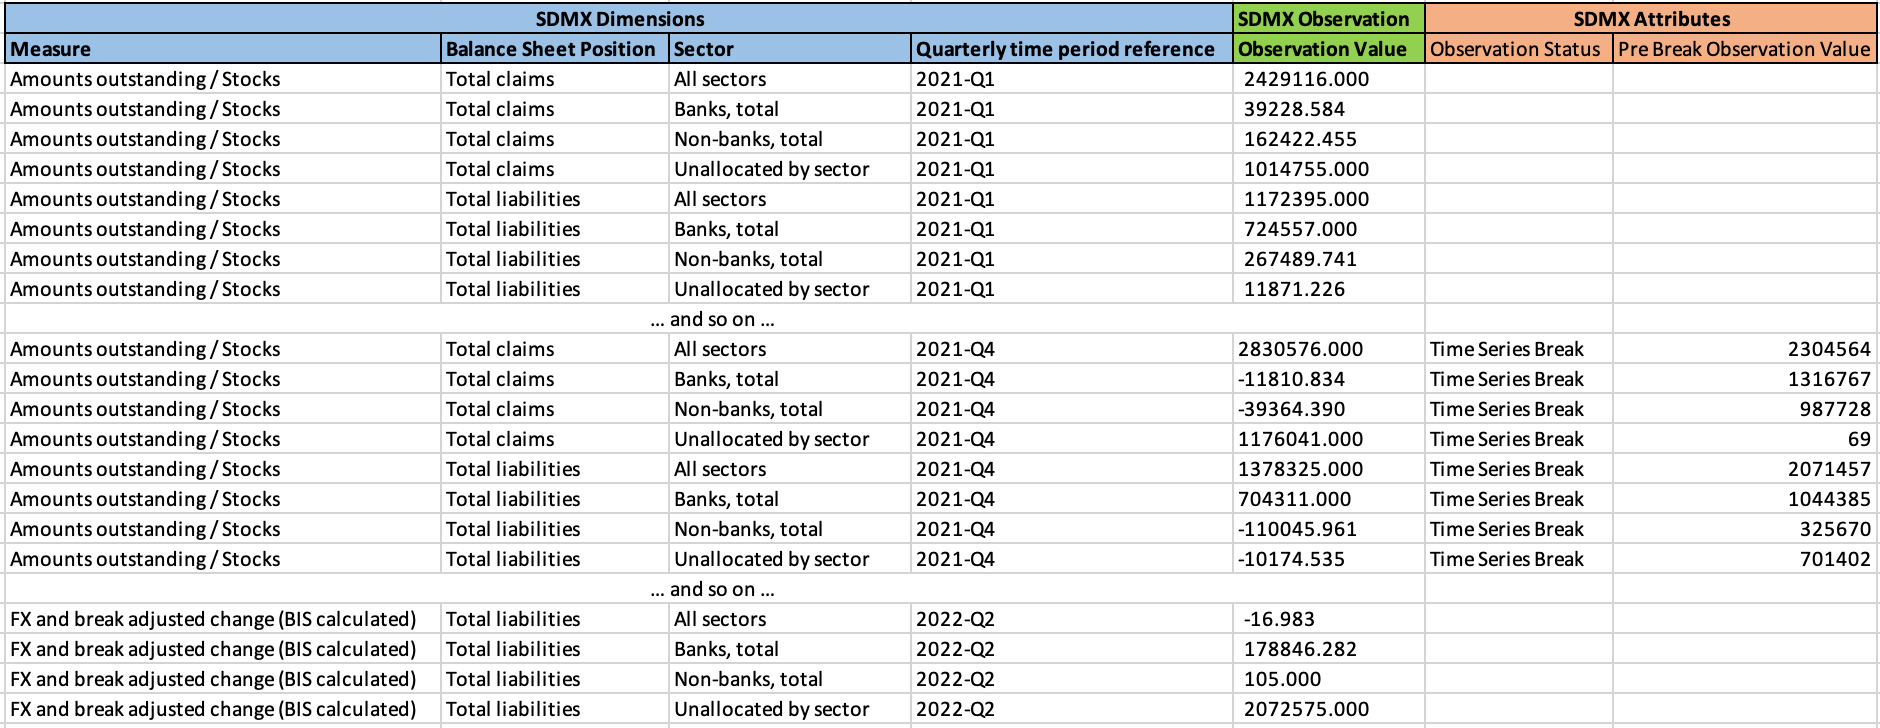
Observation level metadata to be added
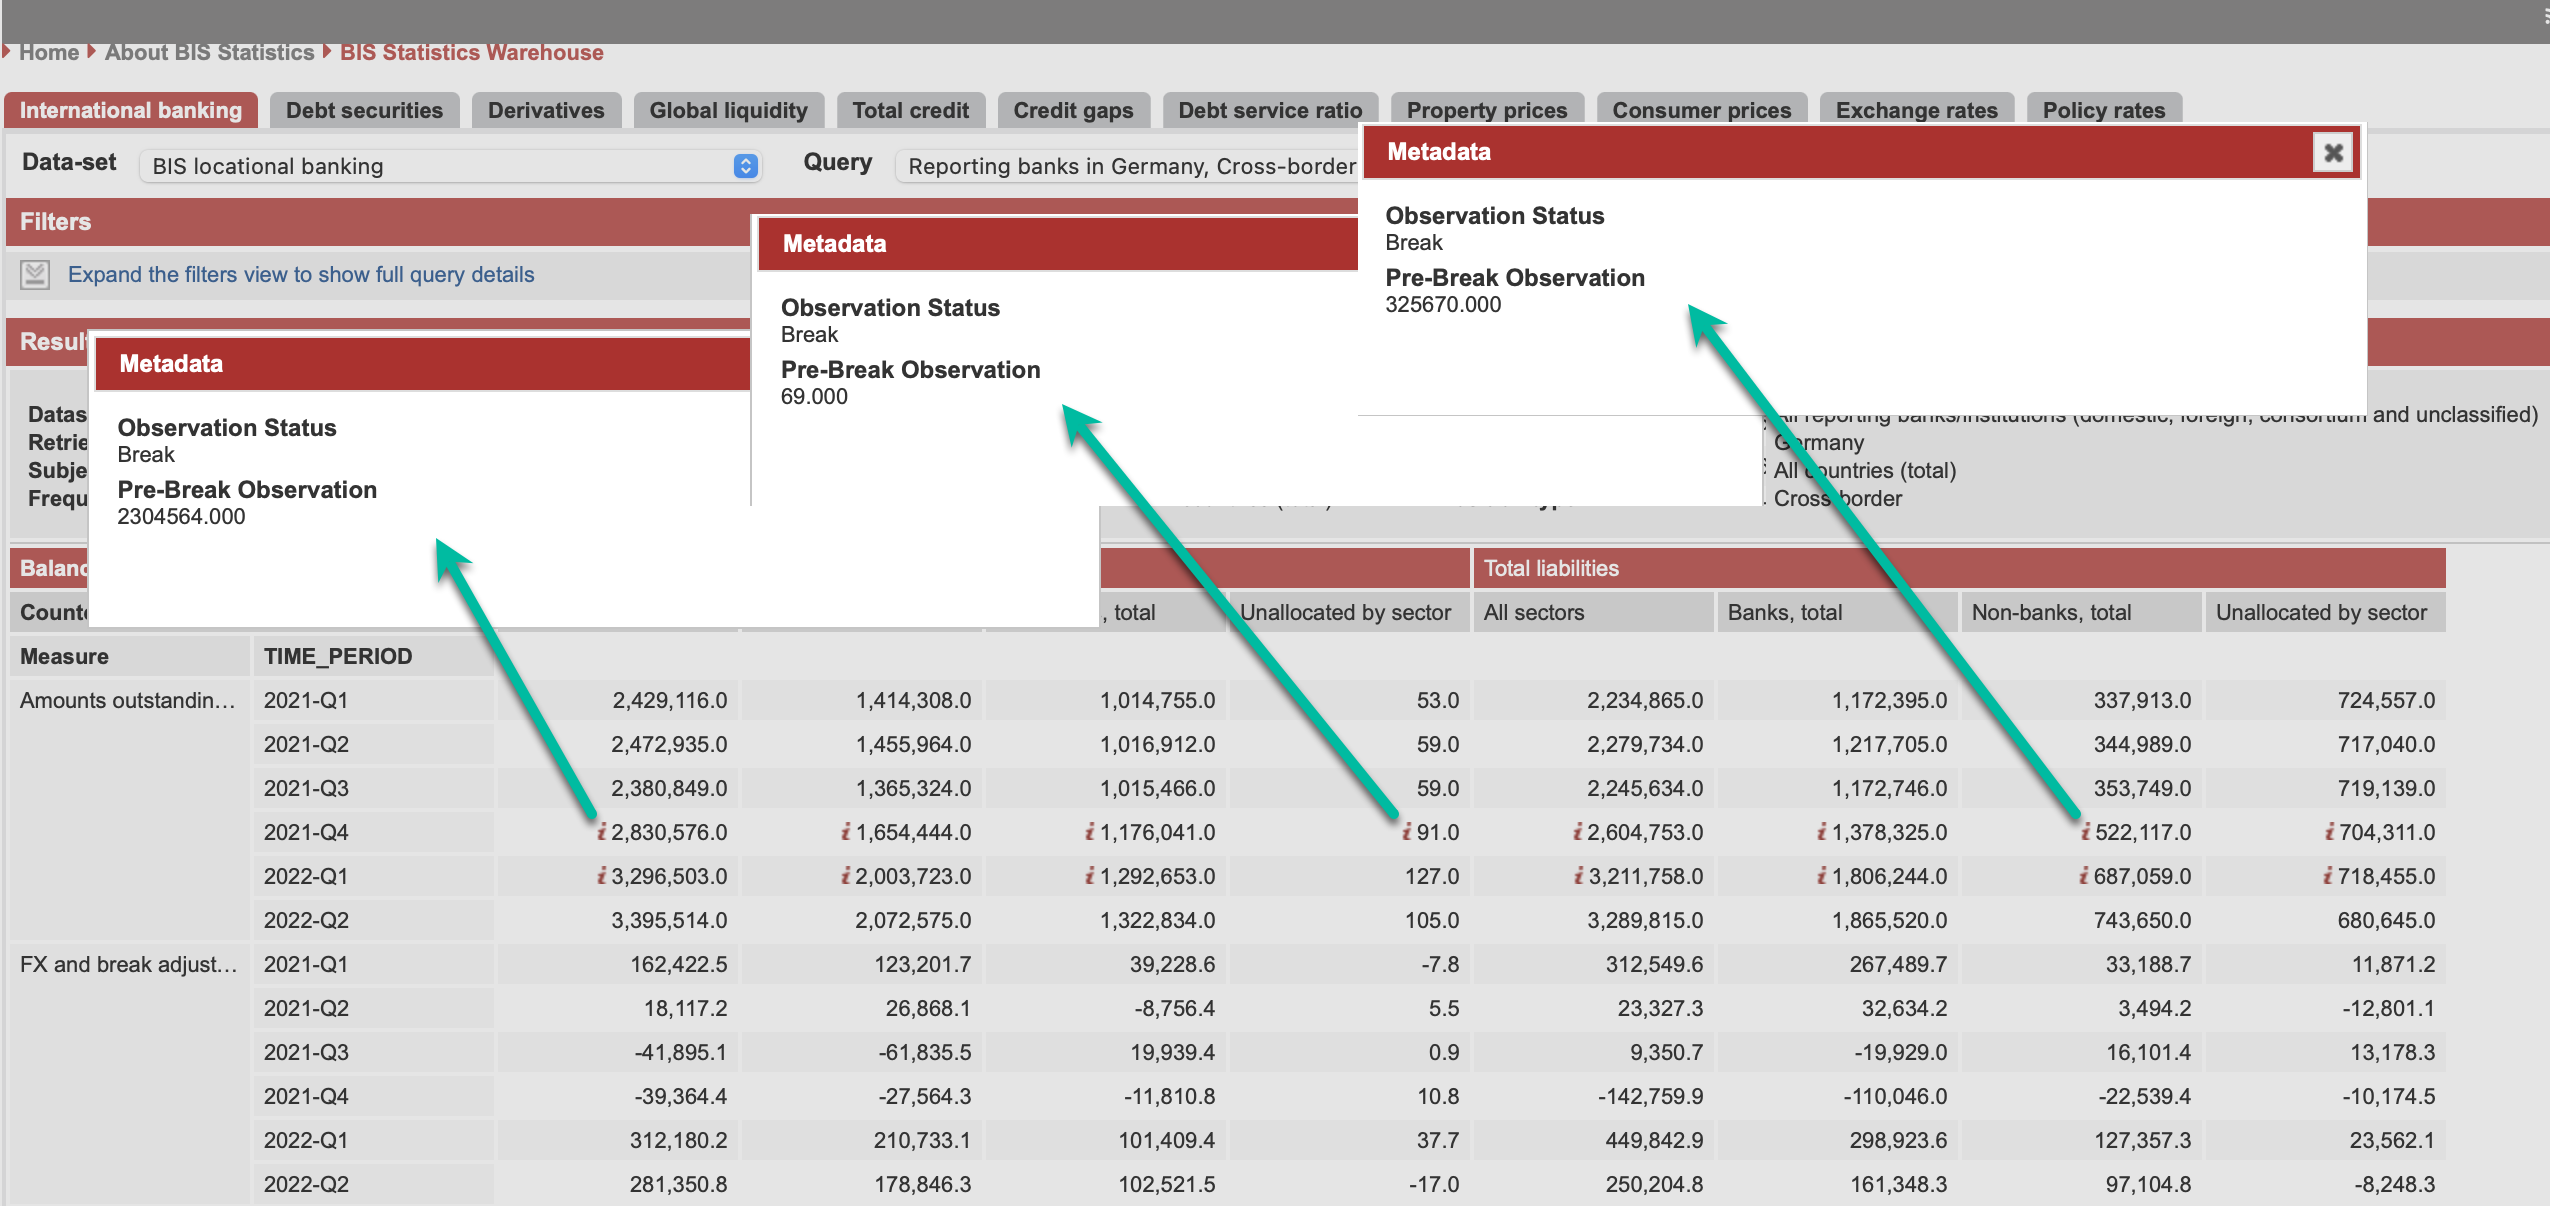
First, we will add the observation level metadata for time series break.
Observation Status
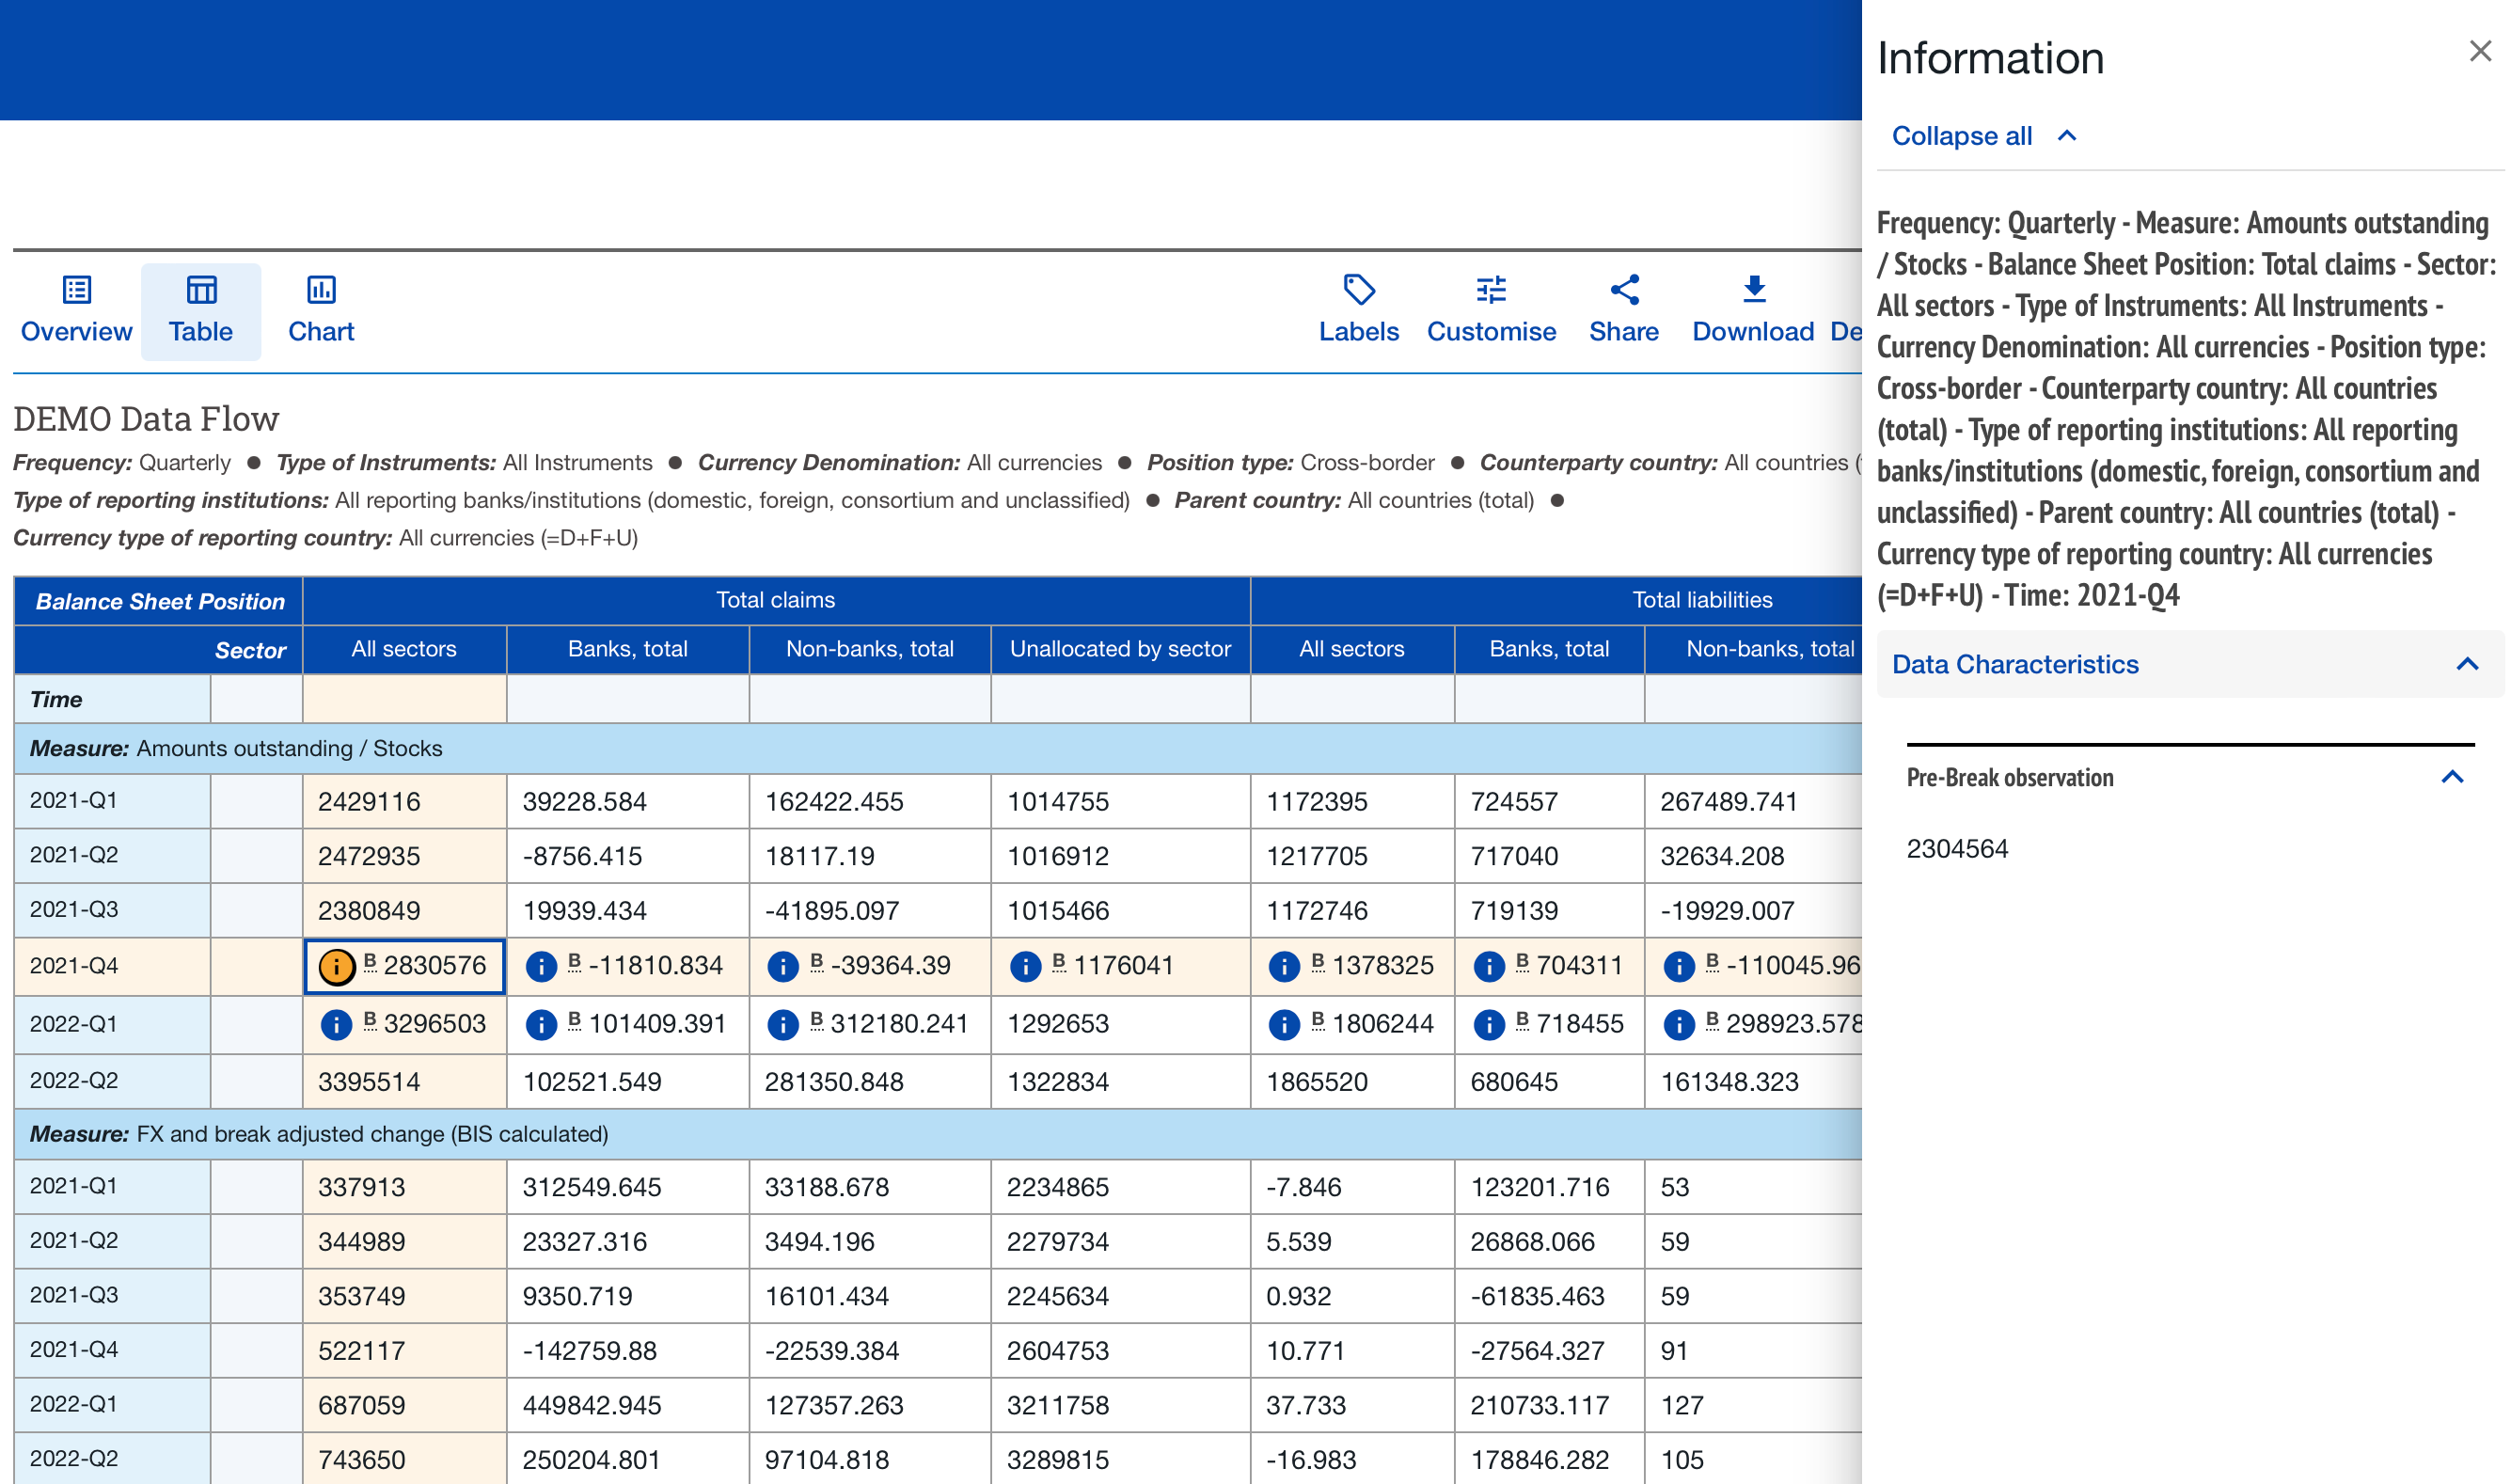
Pre-Break Observation
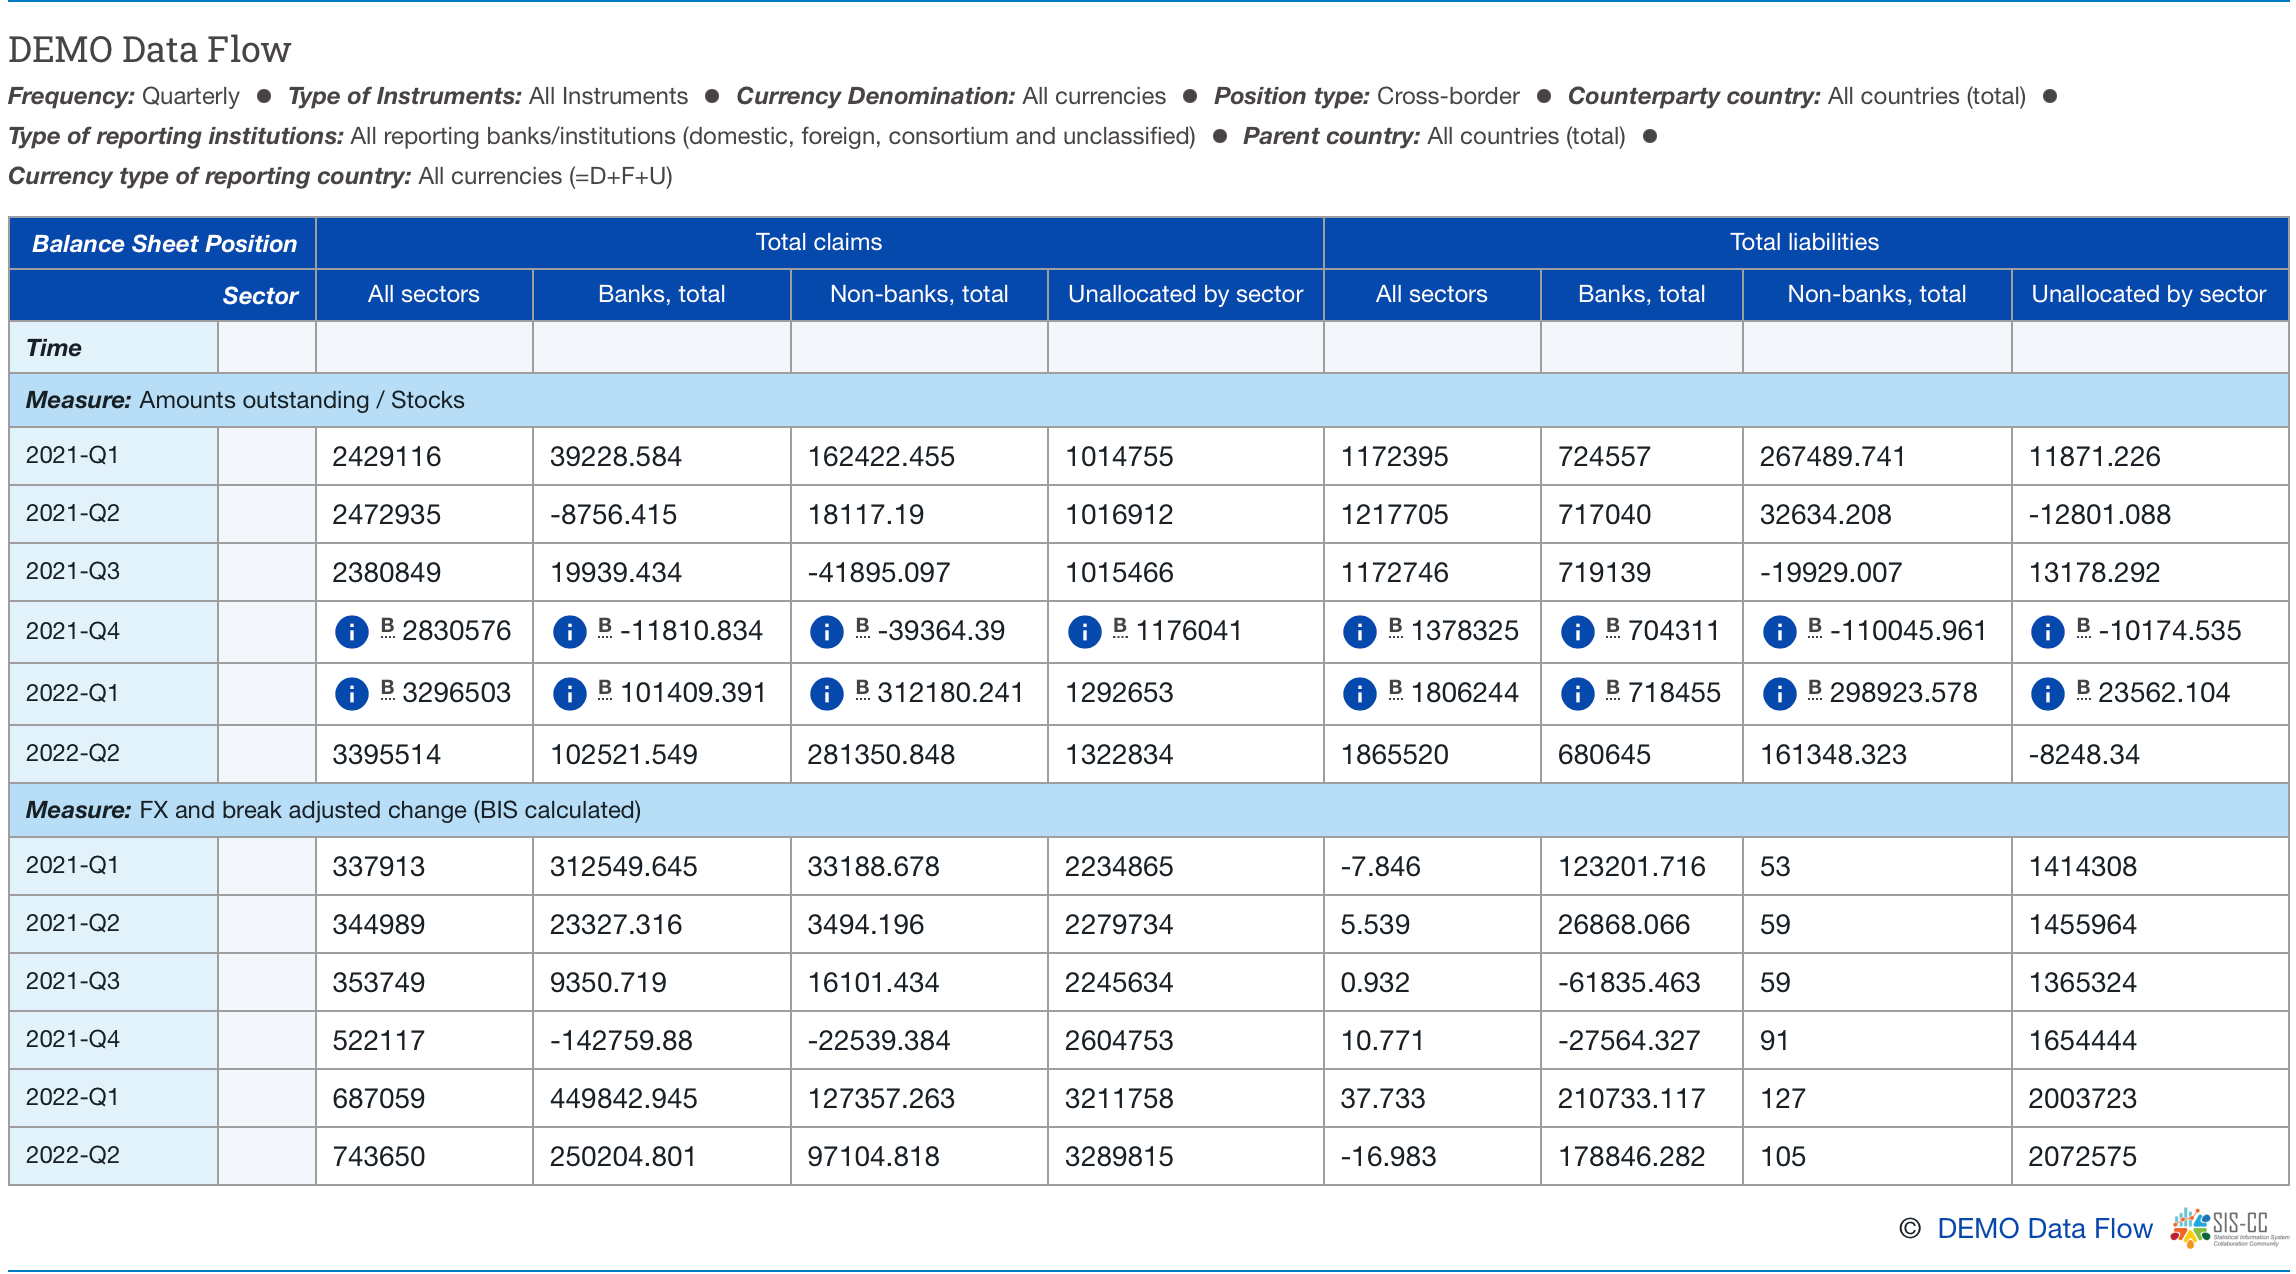
These observation level metadata in the BIS table are purely descriptive. They add useful additional information to the observations and they do not help to identify the observations. In SDMX terminology, observation-level metadata which are purely descriptive are referred to as Attributes. Observation-level metadata which both identify and describe an observation are referred to as Dimensions. All observations can be fully described in SDMX with three concepts: Attributes, Dimensions, and Observation Value.
Observation Status
It is possible to satisfy the “Observation Status” requirement by attaching the text “Observation Status: Break” to an observation. But, while this is technically valid, it is not the recommended way to indicate a series break.
The recommended way to indicate a series break is to introduce the SDMX concept of Observation Status to your data model. There is an internationally accepted and maintained list of Observation Status codes for use in datasets (TIP: google “SDMX observation status” for the latest recommendations). The accepted default Observation Status for all observations is “N”:
Codelist item: N
English Label: Normal
The accepted Observation Status code for “Break” is “B”:
Codelist item: B
English Label: Time Series Break
BEST PRACTICE: The recommended way to introduce the concept of “Observation Status: Break” is to extend your Data Model by adding the Concept of Observation Status as an Attribute (type: has codelist) and whenever a Series Break occurs in your data, assign the codelist id of “B” (Time Series Break) to the Observation Status Attribute of that specific observation.
It is important to note that whenever Time Series Break is specified for an observation, it is MANDATORY to also provide a Pre-Break Observation Value for that observation. If an Observation has Observation Status = “B” and there is no Pre-Break Observation Value specified, an error condition will exist and the dataset will fail SDMX validation.
Our data model is thus modified to include SDMX attributes of Observation Status and Pre-Break Observation Value.
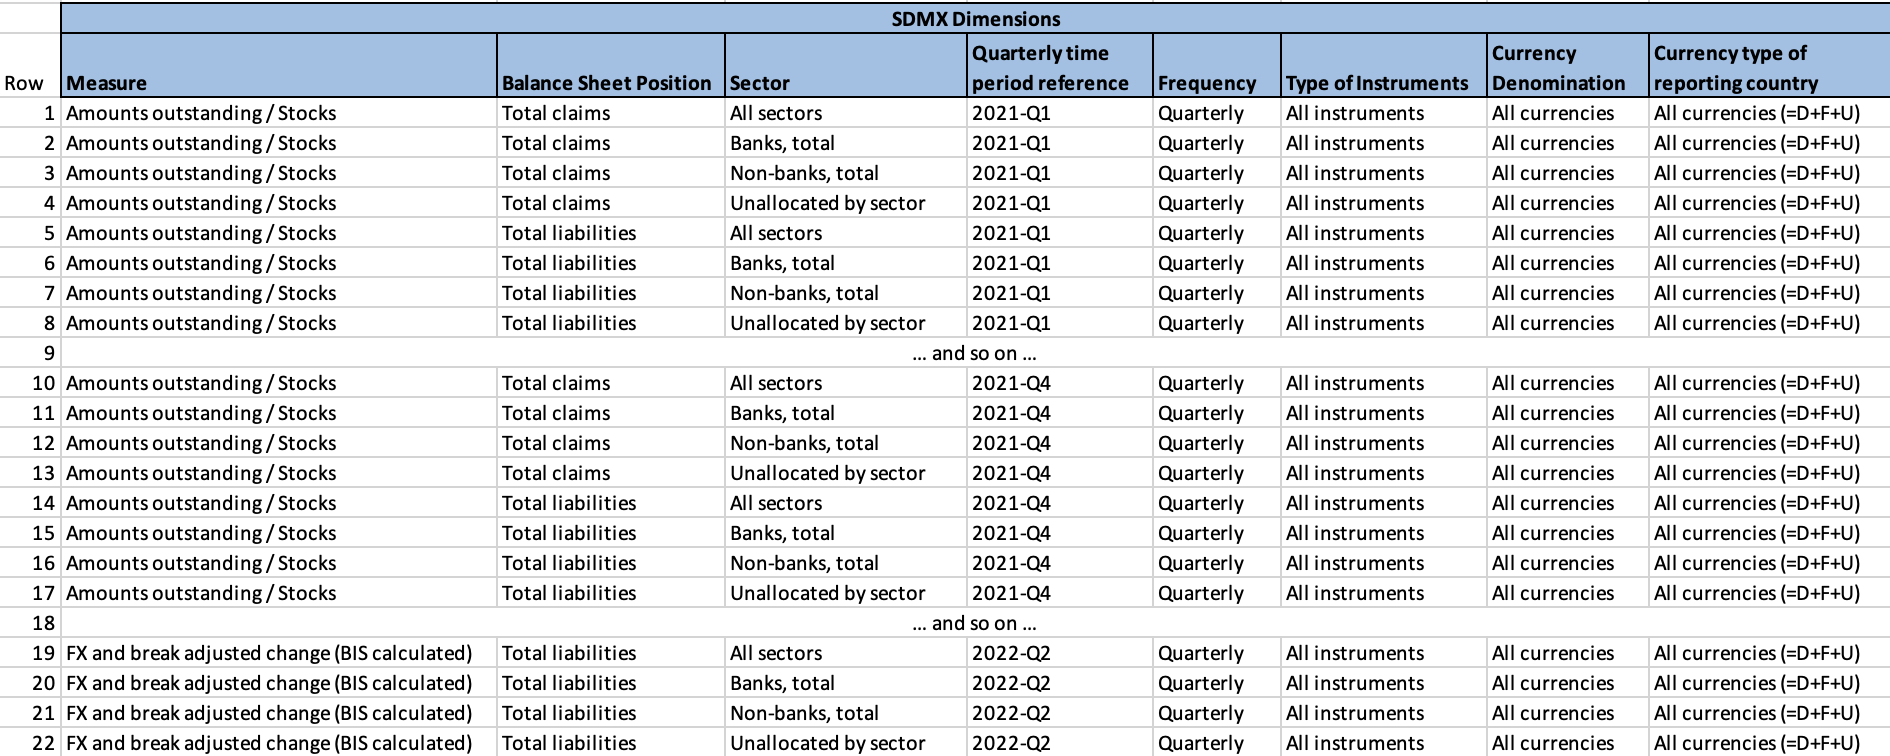
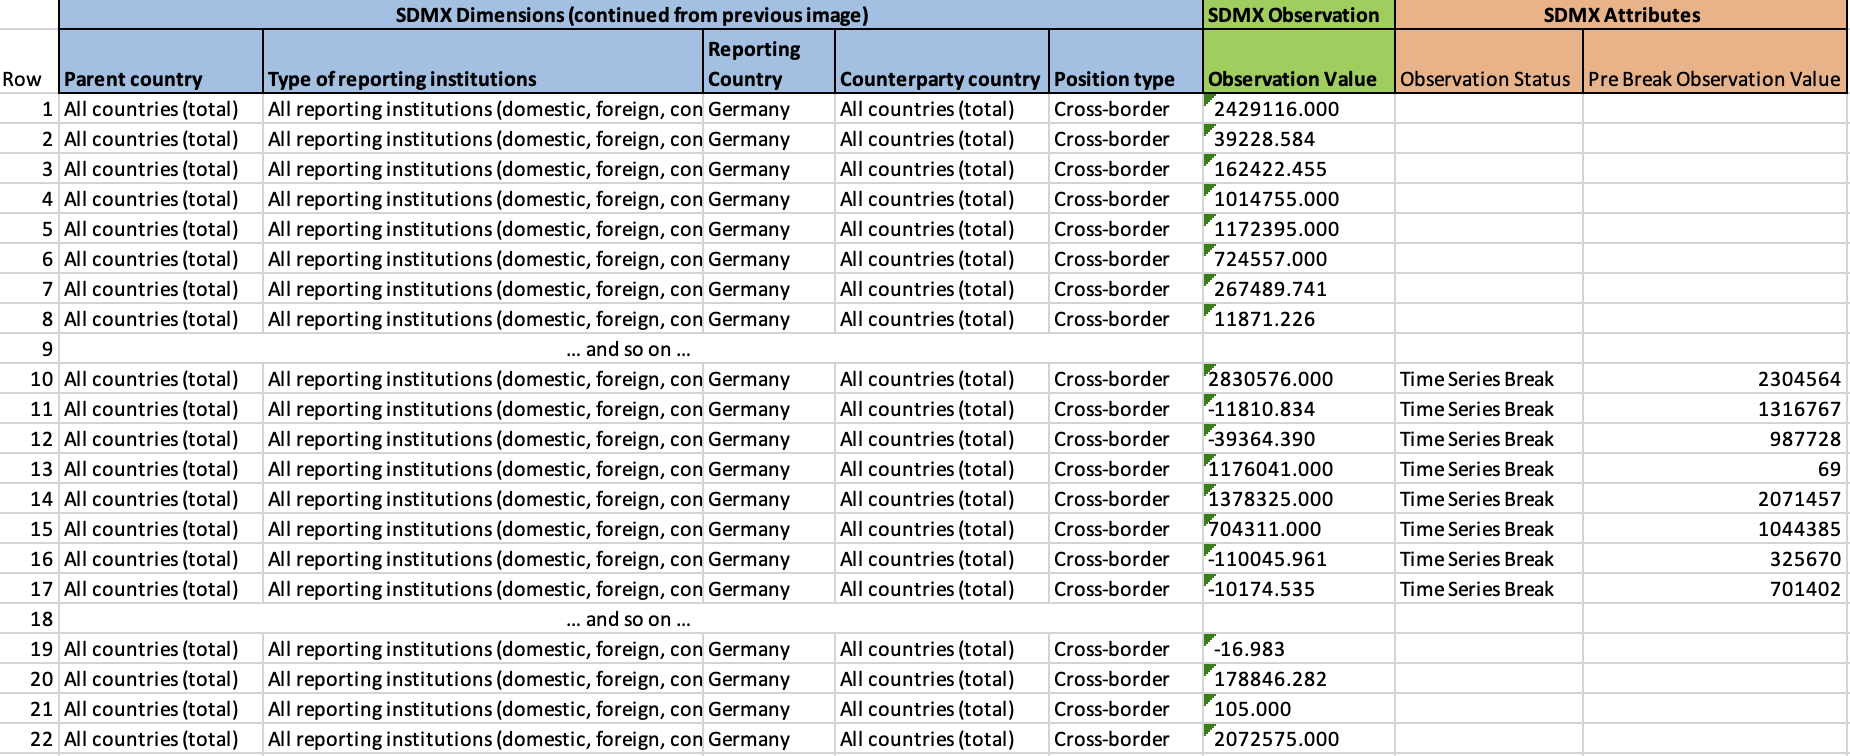
Table, or Dataflow, level metadata
Dataset
Retrieved on
Subject
Frequency
Type of instruments
Currency denomination
Currency type of reporting country
Parent country
Type of reporting institutions
Reporting country
Counterparty country
Position type
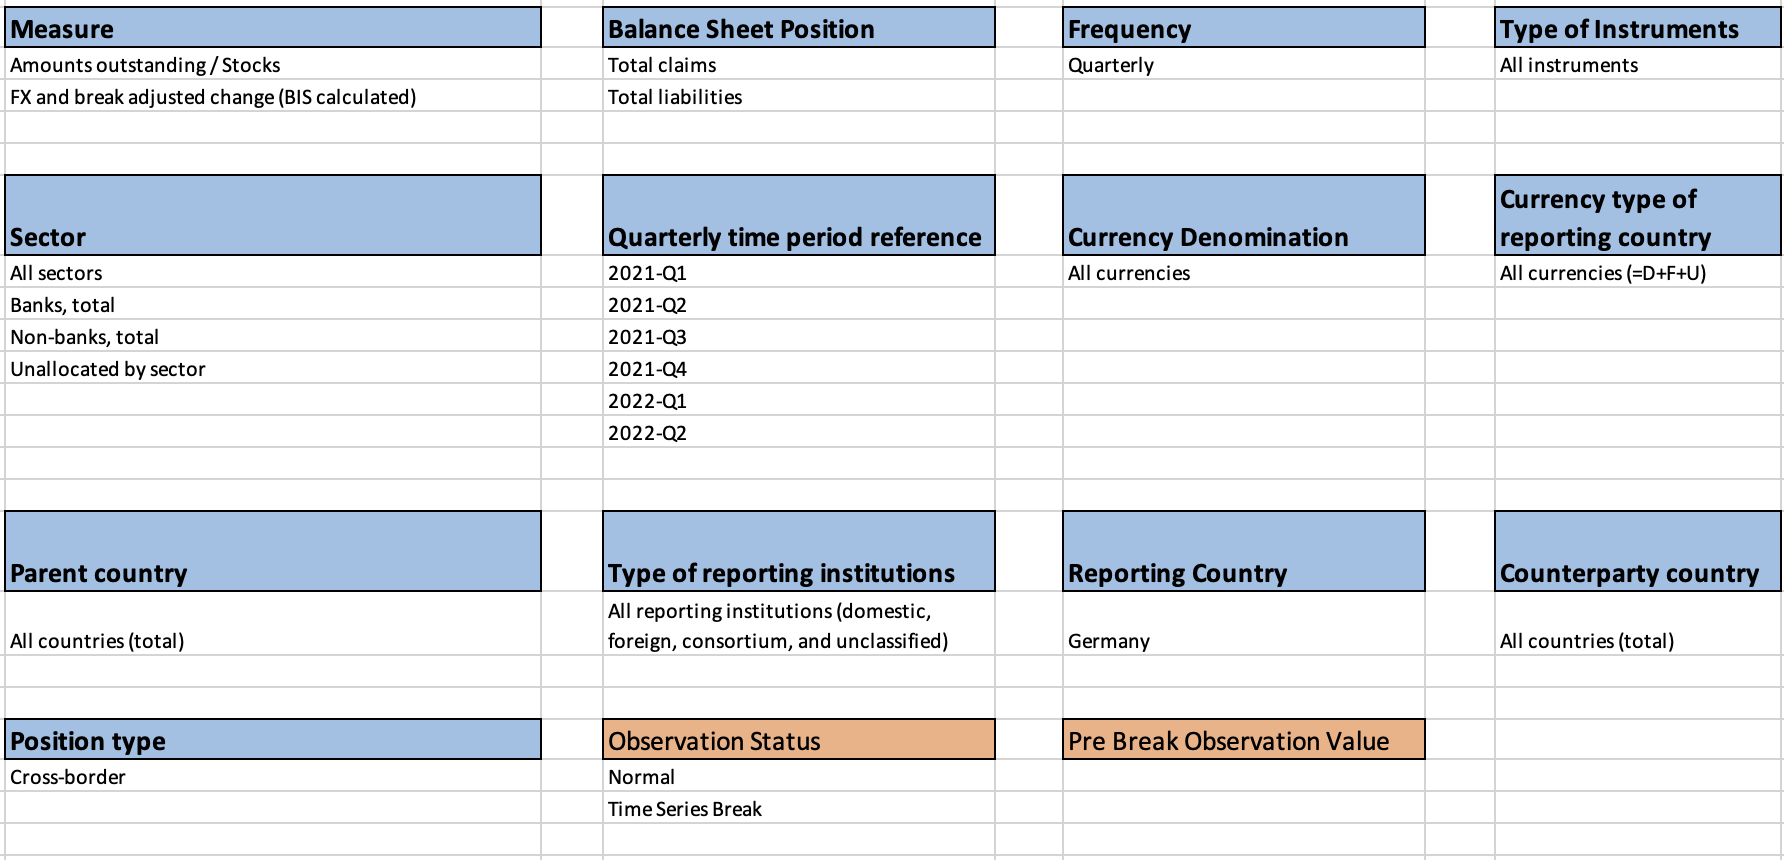
A number of items in the above list are purely descriptive metadata: “Dataset”, “Retrieved On” and “Subject”. The remaining items on the list are used to both identify and describe the observations, thus they are SDMX Dimensions.
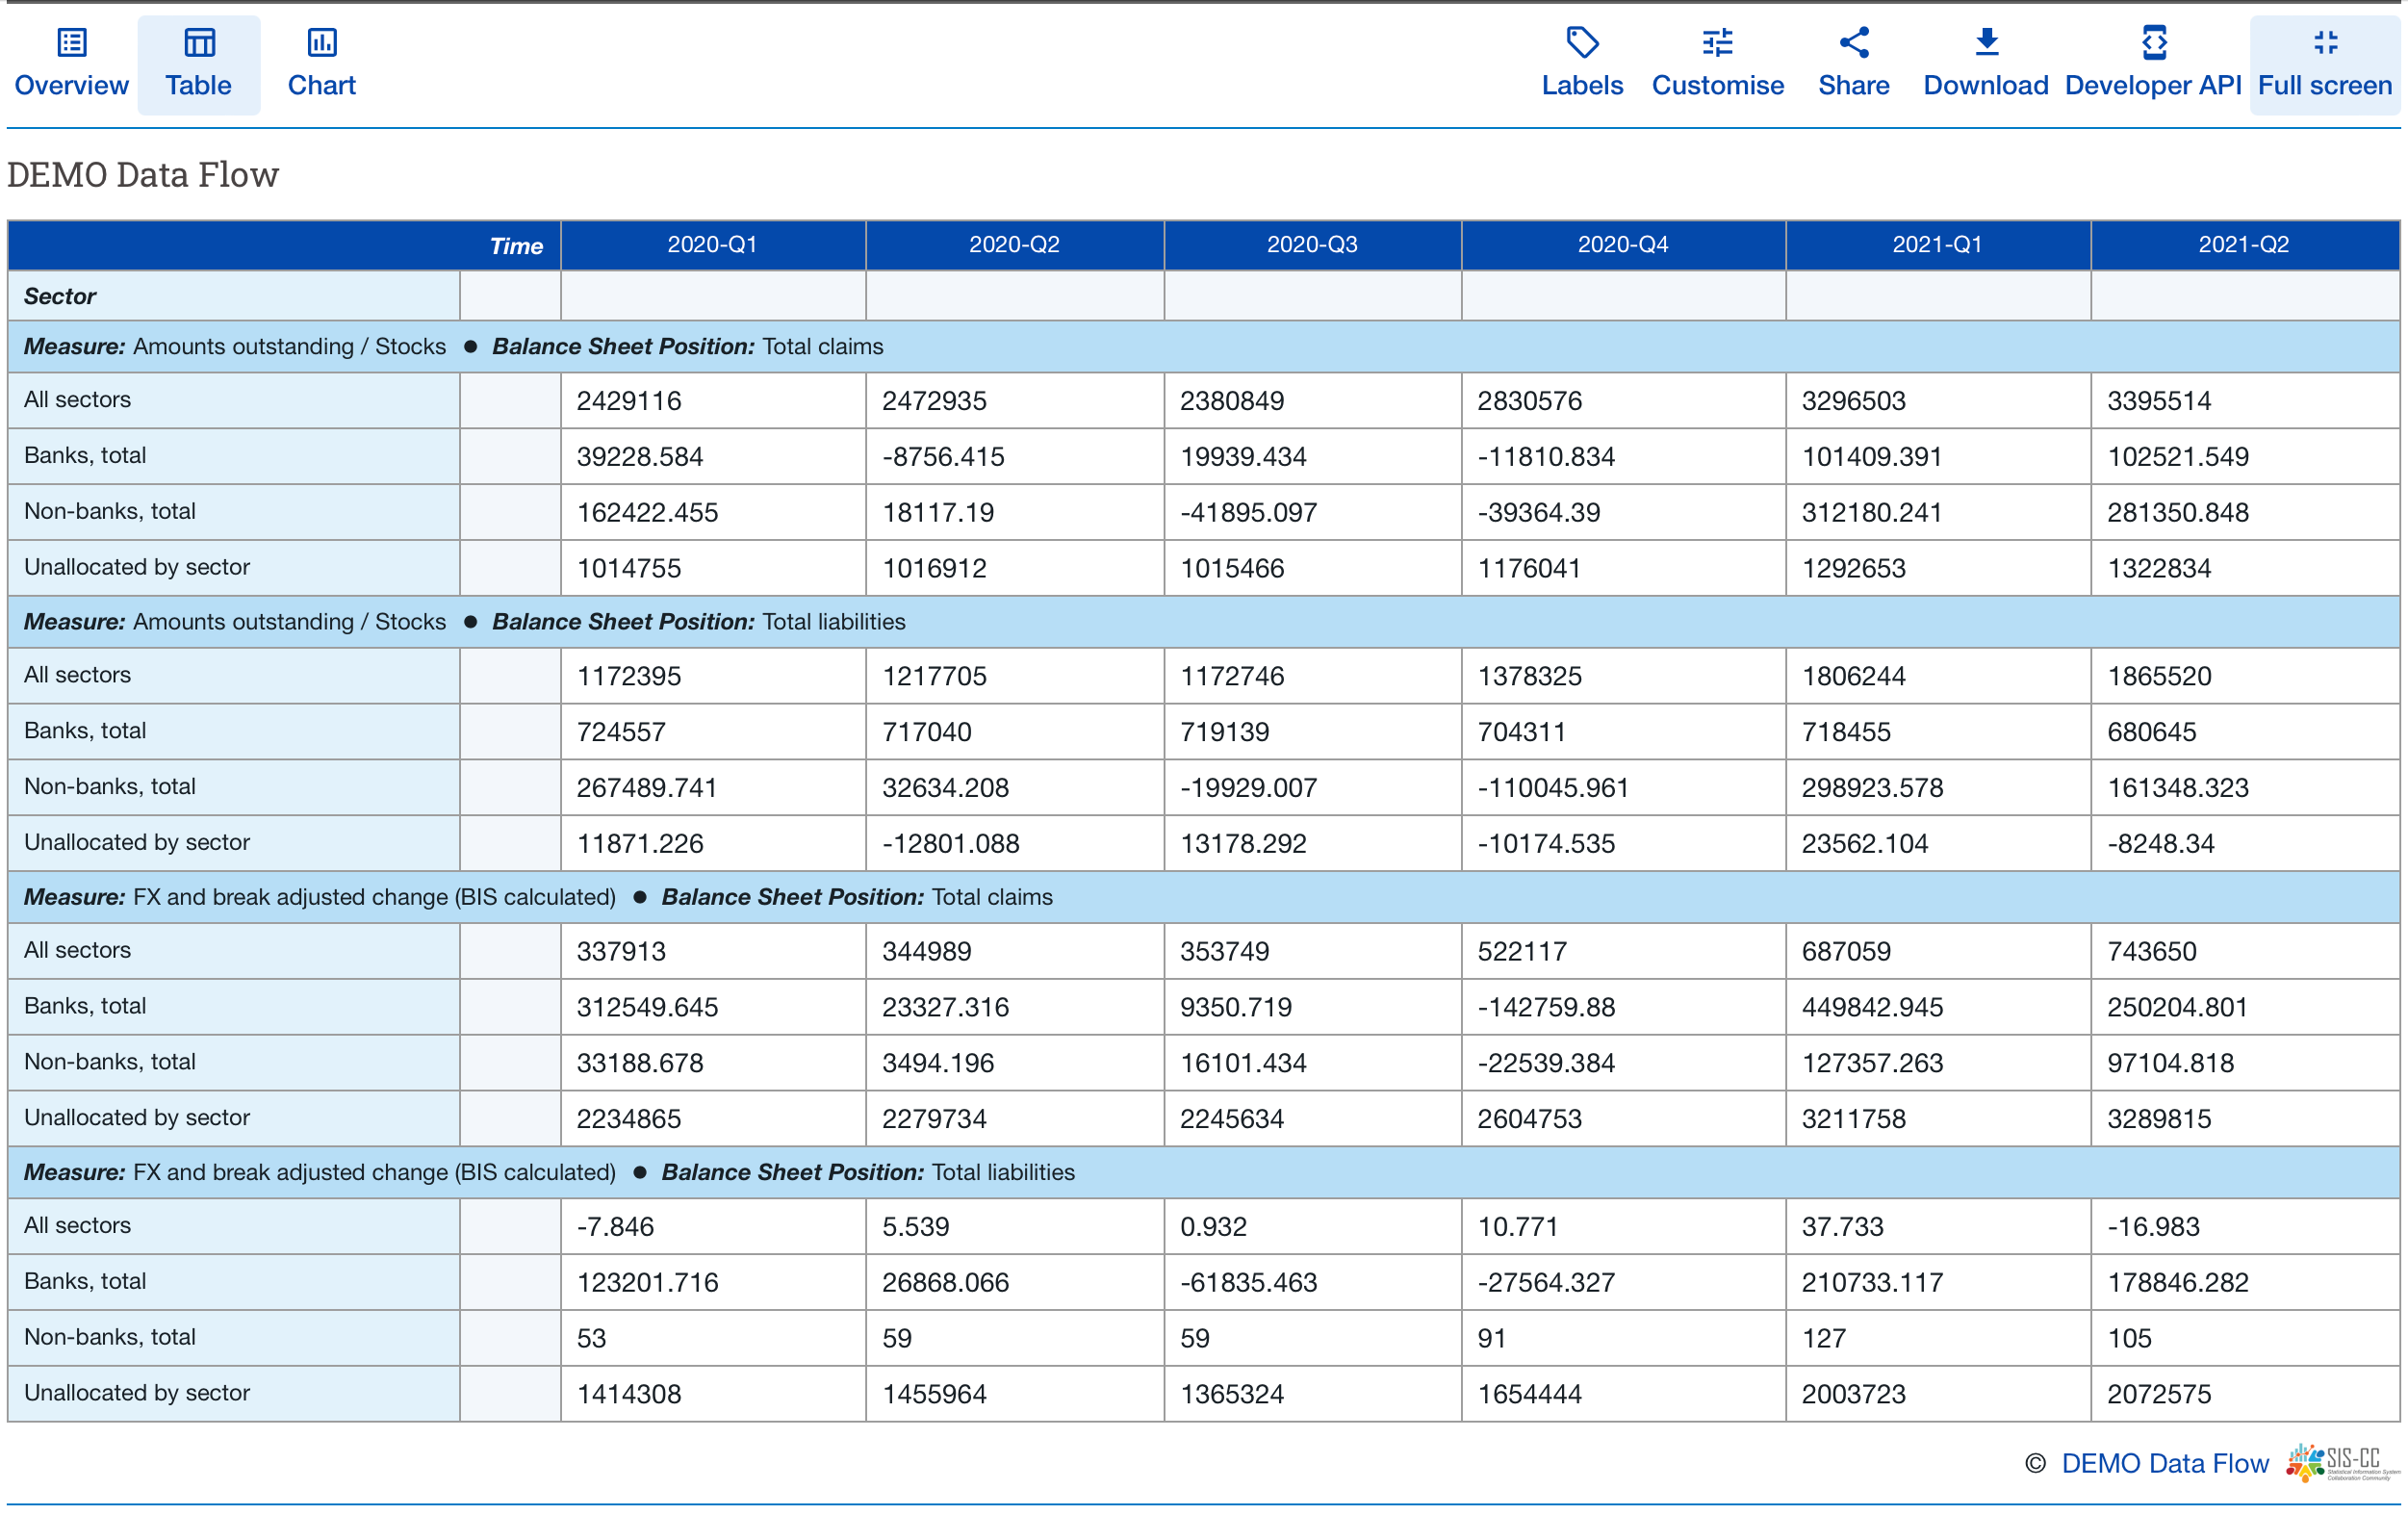
These SDMX Dimensions are integrated into our “one observation per row” dataset view as follows:
As before, the next step is to represent these data and metadata in our data model. The revised data model is represented by the following diagram:
It is now time to repeat the process outlined in the previous article to load this model into the Fusion Metadata Registry (FMR), create an XLSX data collection template, filling in the data, the Time Series Breaks, and the Pre-Break Values provides us with the metadata and the data that we need for publishing in our .Stat data portal.
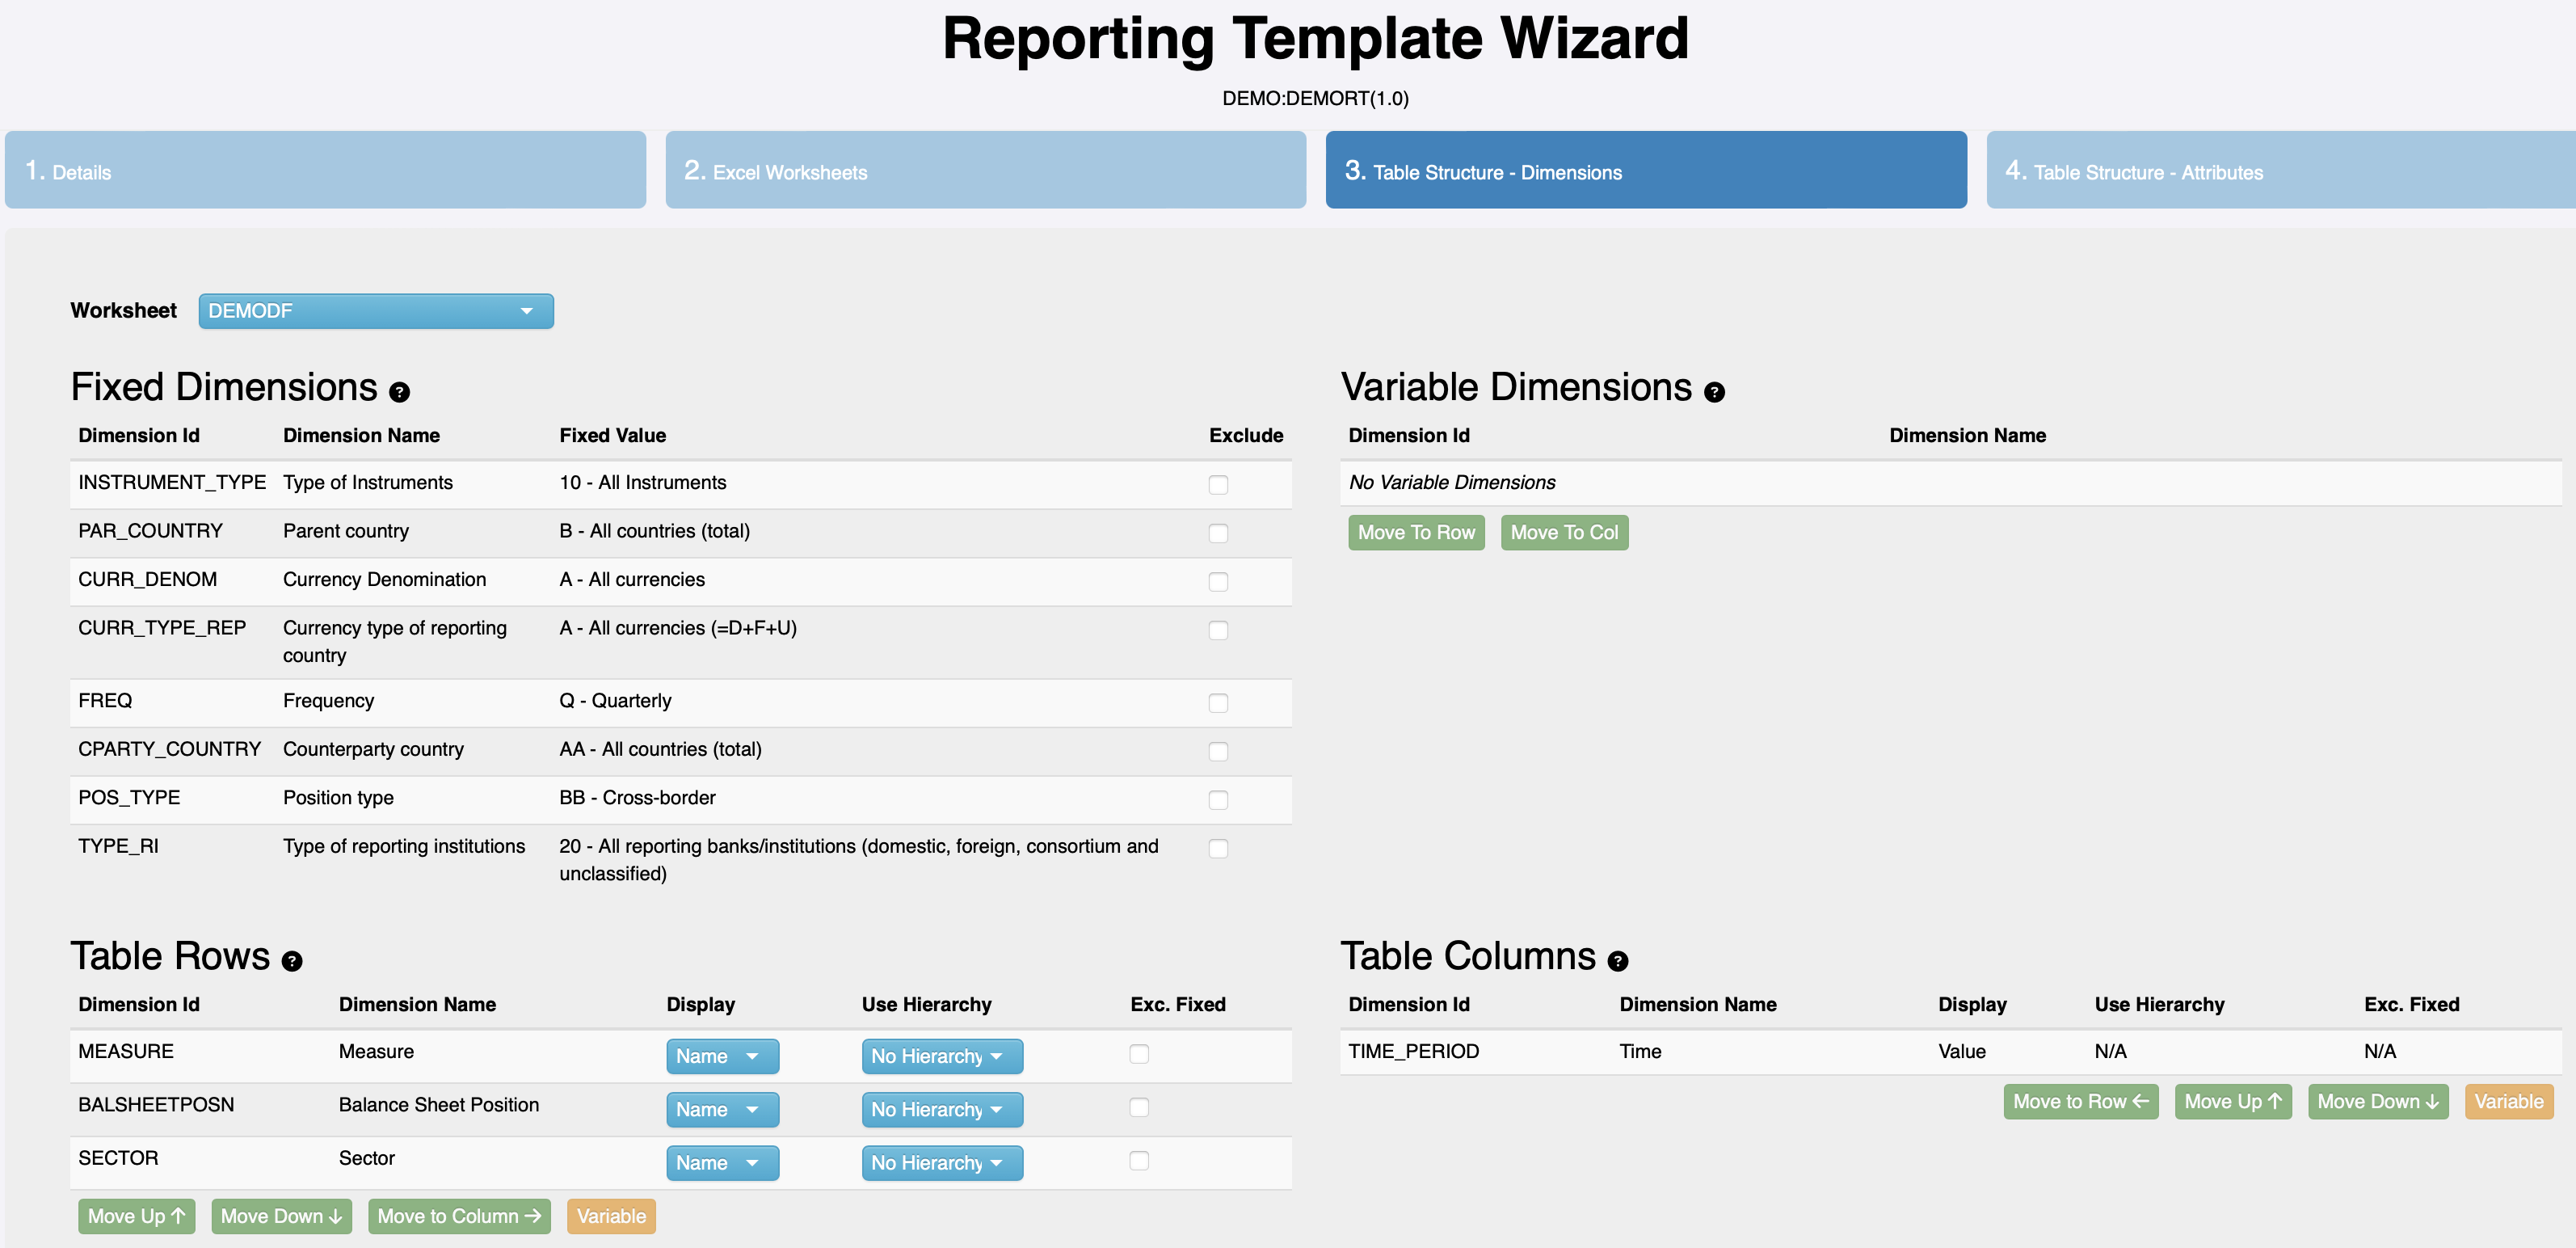
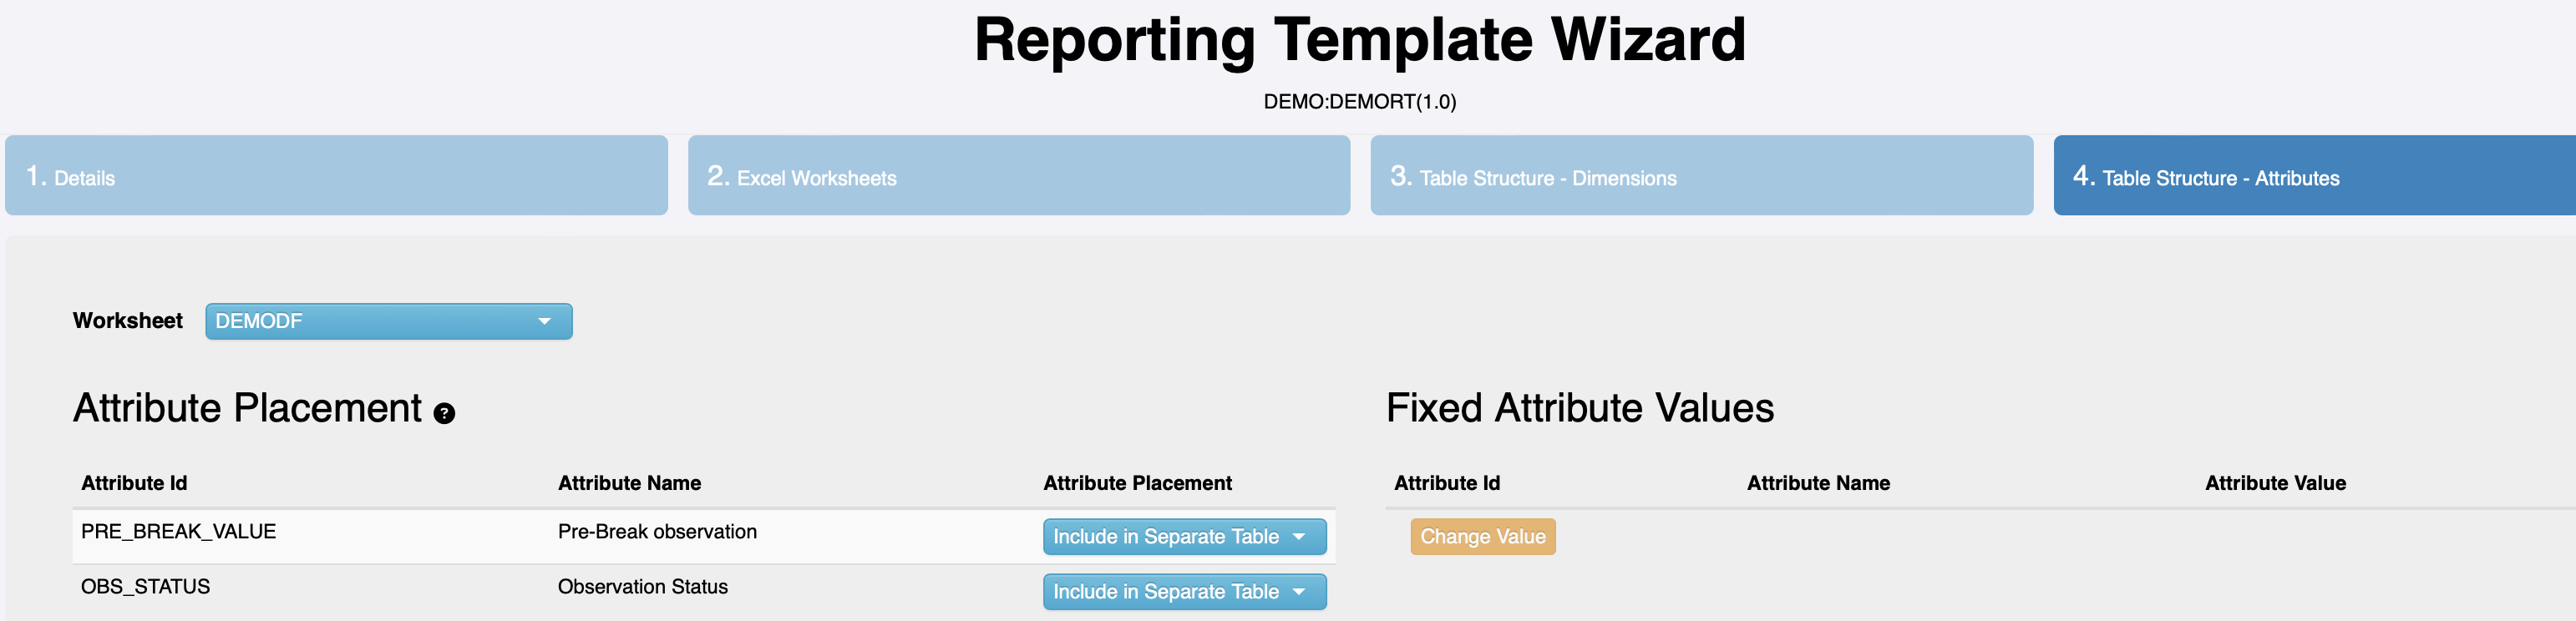
Refer to the following images from the design of a reporting template for our revised data model in the FMR reporting template wizard. Note the additional content in the “Fixed Dimensions” section of the template. These dimensions have only one valid code for this table (dataflow) and are therefore considered ‘fixed’. :
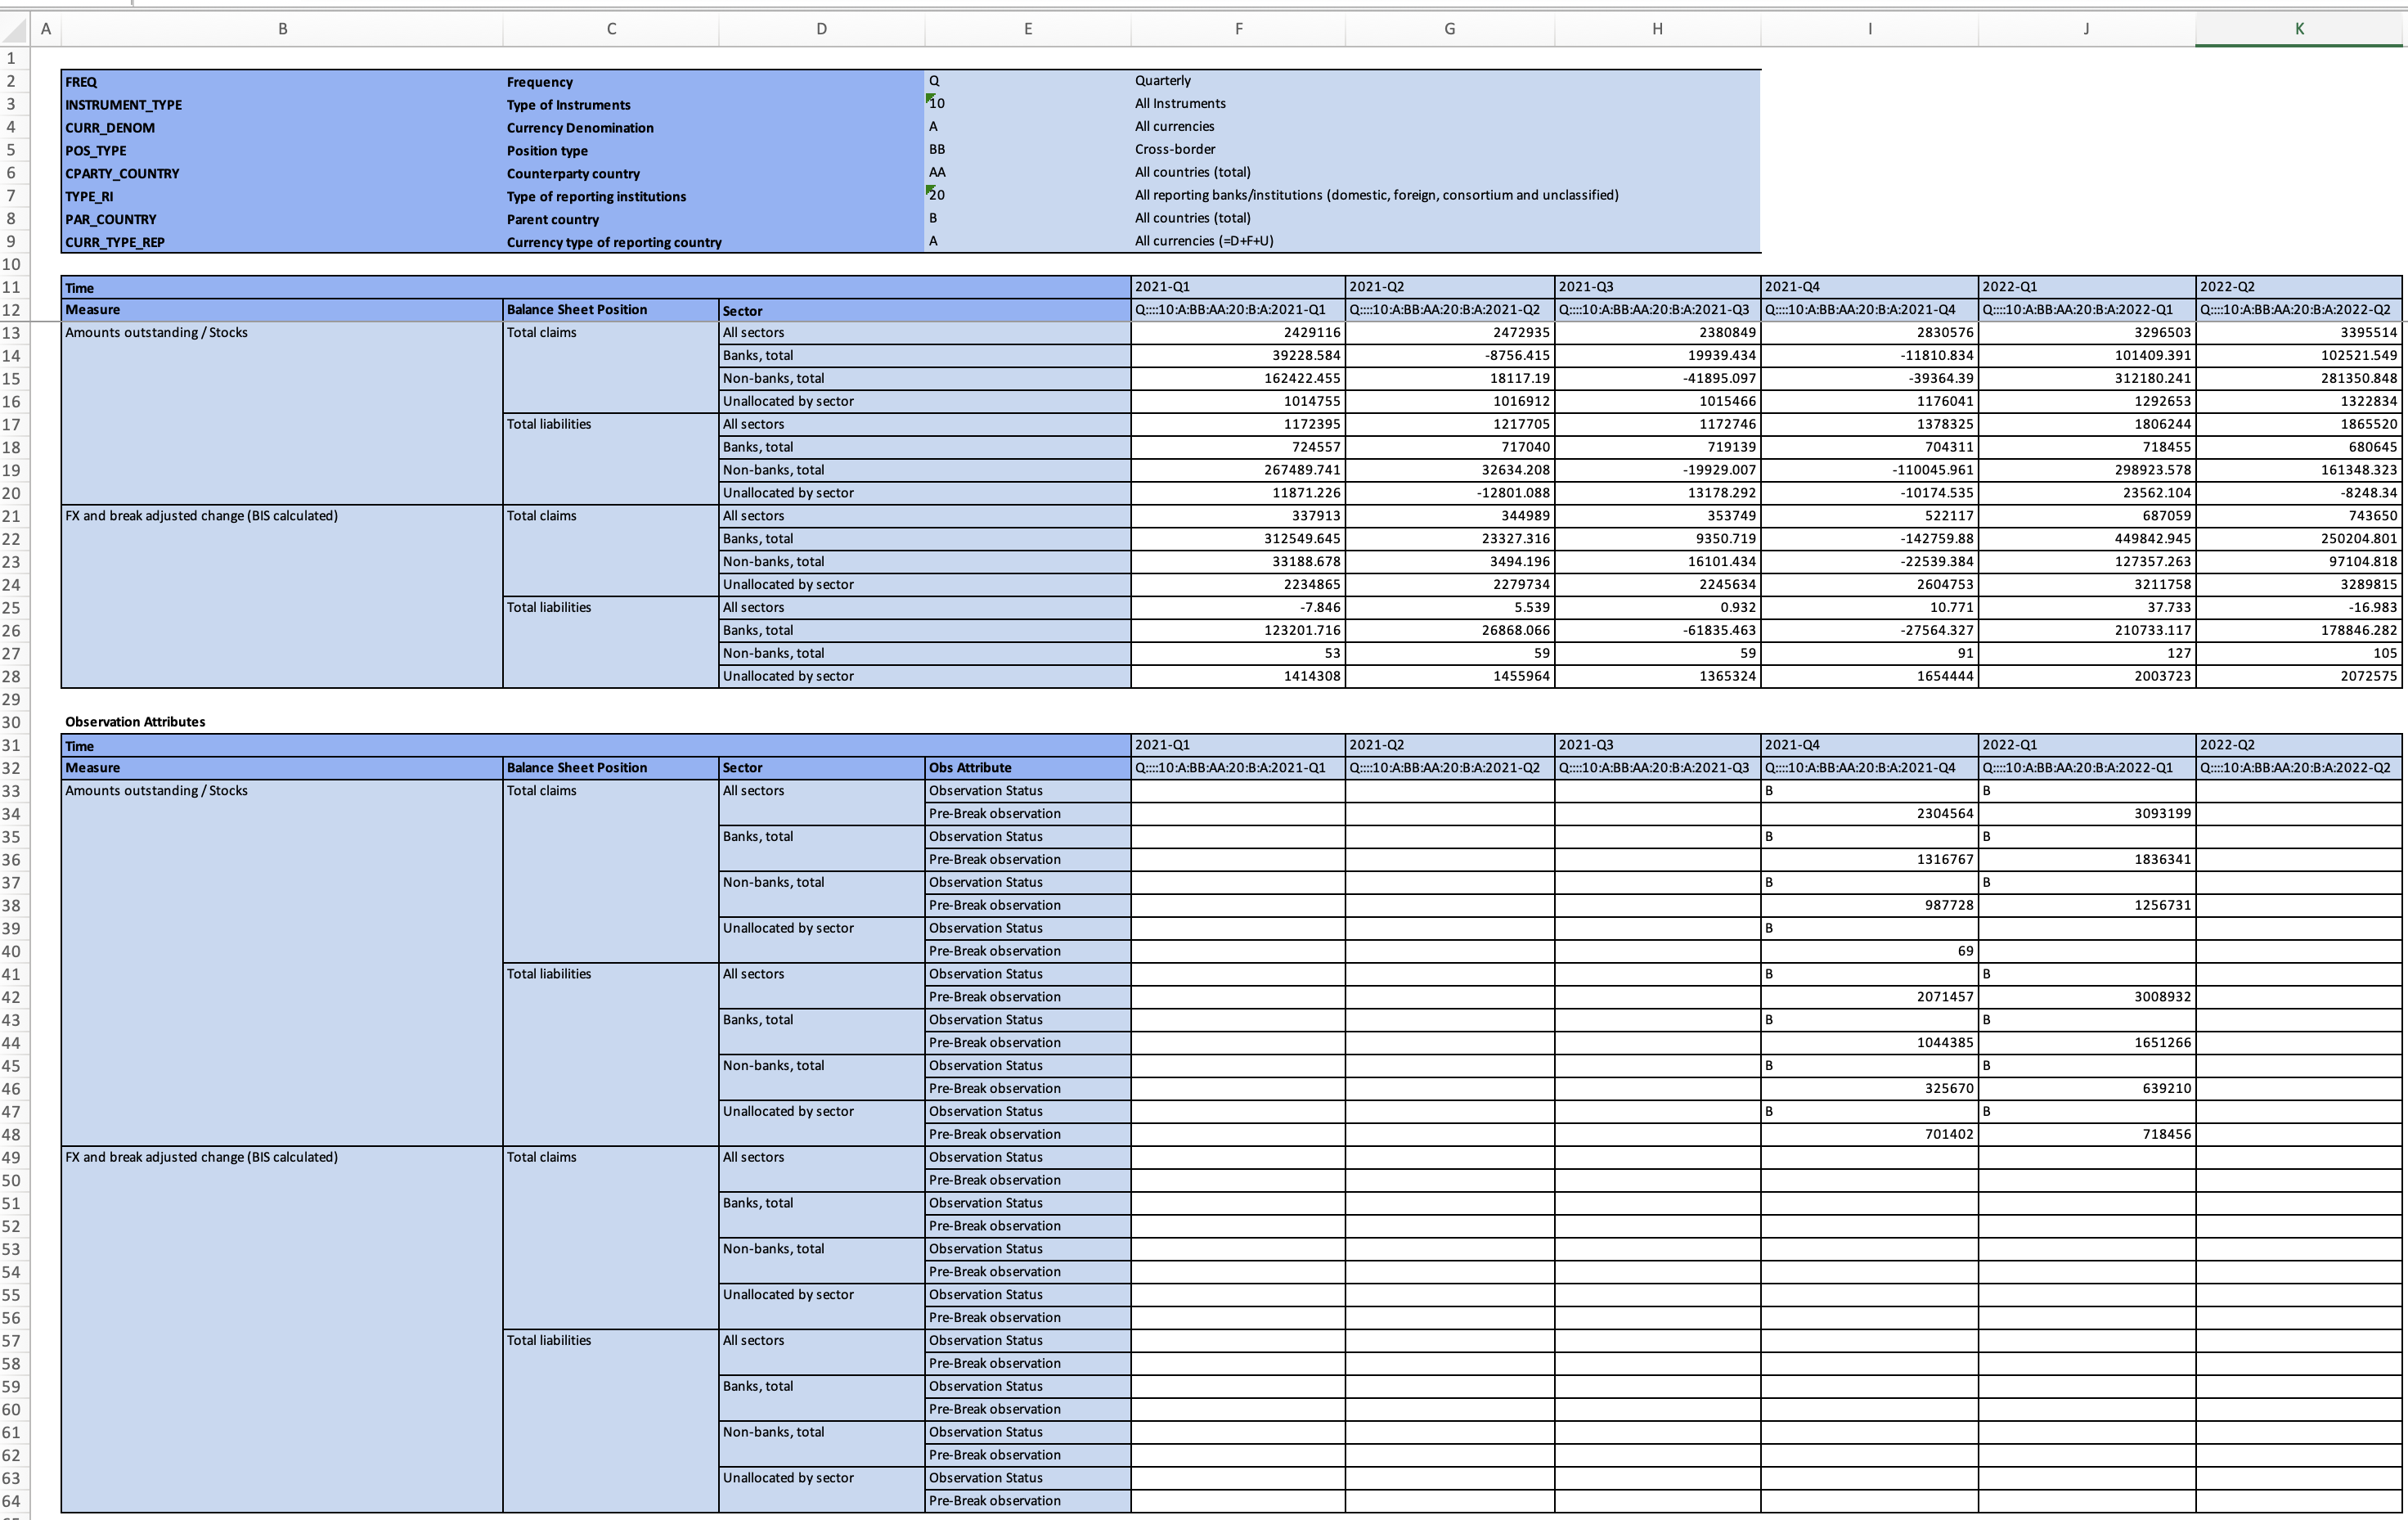
In this next image can see the XLSX template filled in with data for Germany, including time series breaks and pre-break values.
Converting and exporting these data, exporting the structural metadata, and then uploading both into .Stat allows us to customise and present the following data table and observation-level metadata in our .Stat data portal:
Summary
This article introduced the concepts of SDMX Dimensions and SDMX Attributes, fixed dimensions in a dataflow for reporting and dissemination purposes, and how to represent Time Series Breaks using SDMX.
This article did not explicitly detail how to perform every step in the process but neither did it hide any complexities. The process works as described. Modelling data, adapting the model to SDMX, and implementing SDMX-based tools to digitalise and improve data production processes is a realistic and achievable goal in teams and organisations of all sizes. Care should be taken to ensure that selected approach is fit for purpose and realistic based on resource constraints however, simple and complex solutions are both possible and it is not as difficult as it might appear at first glance.
The SDMX information model and technical standards are the fundamental enablers of these advancements in data production. The learning process to become competent using the tools and modelling data in accordance with the SDMX standard are being supported through articles and elearning courses and also via the SDMX User Forum.
If you have any comments on this article or would like to see articles on specific topics, please let us know at contact.sdmx.io@bis.org .
References
BIS Data Portal: Data table https://stats.bis.org/#ppq=LBS_REP_BANKS_IN_DE_XB_C_L;pv=2,9~1,12~0,0,0~name
FMR Excel Reporting Template reference: https://fmrwiki.sdmxcloud.org/Excel_Reporting_Template
Related article
BISStatistics Operations
Simplifying Data Collection thru Dissemination using open source tools and SDMX
From data collection through dissemination using open source tools and a data model.
January 16, 2023
BISStatistics Operations
Creating balance equality validation rules using hierarical codelists in FMR
Learn how Hierarchical Codelists can be used to define balance equality validation rules.
July 22, 2022